As statistics show, the state of a family in modern Russia is largely determined by the economic potential of this family (availability of housing, employment, financial resources, the state of the household). In terms of housing provision, Russia lags far behind many countries of the world. In 1998, the provision of one inhabitant averaged 18.9 square meters. m of total area, while in Sweden this figure is 43 sq. m, in the USA -45 sq. m, in Norway -74 sq. m. In 1998, among complete families with 1-2 children, the proportion of the poor was 42%, and among families with 3 or more children - 67.1%.
The highest concentration of poverty is observed in the groups of temporarily unemployed, children and youth aged 16 to 24, men and women aged 25 to 45 who have a family. Currently, according to the government of the Russian Federation, 25% of the population of Russia is below the poverty line. According to the estimates of the Ministry of Economic
As of 2007, the poverty level will decrease, but the rate of this decrease will not exceed a few percent per year, which indicates the prospect of a widening gap between the incomes of high- and low-paid groups. According to experts, the most significant reasons for the decline in the level of real money incomes of all groups of families with children are: crisis phenomena in the economy, inflation, low wages in the public sector, unemployment in explicit and hidden forms, a high proportion of families that have not been able to adapt to conditions transitional period.
In our study, the topic of poverty was also dominant. As a result of economic reforms in St. Petersburg, many enterprises of the military-industrial complex were liquidated, social programs and services at large enterprises were reduced, and unemployment among women with several children increased. Among the unemployed in St. Petersburg in 2006, 70% were women and 21% were young people between the ages of 16 and 29. The main factors determining employment are the level of education and age. With a higher education, the opportunity to find a job is much higher, while secondary and secondary vocational education do not guarantee a woman a job and a decent wage. Thus, according to state statistics of the Russian Federation, the proportion of women with higher education, officially registered as unemployed, in 1995 was 10.6%, vocational secondary - 34.9%, and complete secondary - 38.8%. In 2001, unemployed women with higher education accounted for 12.2%, those with secondary vocational education 29.4%, and those with complete secondary education 32.3%. This trend continued in 2005: every tenth woman with a higher education was unemployed (11.5%), while among women with a secondary vocational education - every fourth (25%), and with a complete secondary education - every third ( 31.5%). In our study, a third of mothers with a secondary education were also unemployed or worked odd jobs. None of the participants had a higher education at the time of the interview; many of them could not find paid work on their own. Most of the study participants, as well as fathers large families sv, are limited by the barriers of insufficient education, which in market conditions does not allow you to have a well-paid and stable job.
Discussion of the reasons for the poverty of families with children caused a strong reaction in all groups of parents. According to the participants of the study, the family at the birth of a second child practically goes into the category of "poor and very poor." The main strategy of family life is “survival”, which is most often associated with saving financial resources, food, time for family leisure and communication with children, and the vitality of the parents themselves. With the existing system of wages, low income even with two working adults in the family and a negligible subsistence level for children and adults, poverty becomes chronic. Many simply do not have hopes to overcome it. Many women also complained about the amount of child allowances: “In order to receive an allowance for which you can buy slippers, in fact, you need to submit a whole package of documents. You need to trample your feet to child allowance receive, although they say that Petersburgers are in an advantageous position. In addition, it is tied to the subsistence minimum, and the minimum is lowered to unprecedented lows. As T. N. Poddubnaya and A. O. Poddubny rightly point out, families with many children are the least well off, with a low income per family member. In the structure of income, child allowances occupy only a small part. The share of food expenditures is higher, and the structure of nutrition is less diverse than in other types of families. In connection with the constant rise in prices in large families, there are extremely limited opportunities to meet the needs of children and parents in the most necessary items: shoes, clothes, medicines, school stationery.
In accordance with the “Basic Directions of the State Family Policy” (1996), it was envisaged “further development of the system of family benefits, covering support for all families with children; a gradual increase in the share of spending on family benefits, including benefits for pregnancy and childbirth and care for children under the age of one and a half years in the gross domestic product to 2.2 percent.” In fact, the ratio of spending on family and maternity benefits to gross domestic product GDP fell from 0.98% in 1996 to less than 0.3% in 2004. It is important to note that compensations and child benefits do not save families and children from the plight, and it can be quite difficult to get them. According to research by V.V. Elizarov, head of the Center for the Study of Population Problems
faculty of the Moscow State University “in recent years, the level of real help family. More and more, the family is forced to rely only on its own resources. Since 1996, the size of the monthly allowance for a child has grown only 1.32 times. While the subsistence minimum for children has increased 5 times. As a result, the share of the subsistence minimum for a child covered by the monthly allowance decreased by 4 times and amounted to less than 3% in the 4th quarter of 2004. The benefit for caring for a child up to 1.5 years, despite a nominal increase in 2002, in 2004 amounted to only about 7% of the average salary, while in 1996 it was 19.2%. Accordingly, the contribution of these benefits to family incomes and their importance for supporting families with children has decreased.
Since 2006 monthly allowance for children in St. Petersburg was increased. At the age of one to 7 years, including children from large families, it is 450 rubles, 650 rubles. for children from an incomplete family and 900 rubles. for a disabled child. At the age of 7 to 16 years - 300 rubles, 500 rubles. children from single-parent families and 900 rubles. for a disabled child. At the same time, the subsistence minimum for children at the end of 2006 amounted to 3,101.6 rubles, so the child allowance currently amounts to only 10-14% of the subsistence minimum.
As the analysis of the respondents' statements showed, the dominant family strategies in a metropolis are the family survival strategy based on the principle of saving on everything, passive adaptation to circumstances, expectant strategies, self-reliance and state assistance-oriented strategies. At the same time, family strategy is understood as “generalized mechanisms for the formation of family behavior in various spheres of life and in various situations”, and family survival strategies are “family strategies aimed at preventing and overcoming the economic crisis” . According to Irina, the survival of large families largely depends on their own efforts - family income, employment of parents and older children in the family. For example, Elena is more inclined to passive adaptation with a decrease social status and refusal to work in the specialty. She, despite her secondary technical education and the profession of a radio engineer, is forced to work as a cleaner for the sake of her children: “Once I had a situation that I was asked to leave my job because I have five small children. I cried for a very long time and said: “Well, de-
lat, children, mother will have to work with a mop for the rest of her life. Svetlana is characterized by hope for the help of the state. The woman said that she always hoped that the state would remember about large families. But for the entire time of her maternal biography, there was no period when the family would have had relative prosperity, and no one had ever provided significant assistance to the family: “I could never provide for them with my husband, I worked as a nurse in a clinic for a pretty penny. The government has forgotten about us." Tatyana takes a wait-and-see attitude, hopes in God and waits for the best in the future. She spoke about the situation of chronic poverty in her family, which does not allow her to buy the clothes and food that children need: “This year I refused to buy jackets because I cannot buy them. Let's wear the old ones. I hope God will provide next year. The financial side is pushing us very hard.” For Olga, the survival strategy was saving on everything and refusing to meet the needs of children in development and education: “The needs of my family are large - children from 14 to 4 years old. Well, everything is necessary, what do not touch. And you need shoes, you need a computer, everything depends on this unfortunate, notorious money. If I had money, I would buy this computer and pay for everything for it, I wouldn’t go, I wouldn’t be humiliated and I wouldn’t waste my nerves and would devote all my time to children.”
For many parents with many children, frequent changes of places of work, employment with heavy physical labor are typical. The situation is becoming a traditional practice when mothers with many children and single mothers are not hired or fired, so the problem of employment is extremely urgent. At the same time, the wages offered by employers are so low that, on the one hand, they do not cover the needs of a family of several people, and, on the other hand, make a woman's employment simply meaningless. Therefore, many mothers do not have a permanent job, are interrupted by temporary earnings or prefer not to work at all: “I have five children from 16 to 4 years old. Same problem. Material security. Everything is tied to this. And imagine, I'm 42 years old. Even with one child, it is difficult for a woman to find a normal job. Yes? Oh, I have five of them. And even if I come, on the recommendation of the stock exchange, to some work, then they tell me that there is an age limit, and that I have five children, and they will get sick. And if I work, then the whole day and for a penny, and the children at that time hang out on
street." Almost all participants said that they were unable to get a paid job, because they devote a lot of time to raising children and housework: “I can’t afford a well-paid job because I can’t work twelve hours somewhere. So, they will be thrown away from me.”
As shown in the works of I. E. Kalabikhina, the vast majority of incomplete families also have the characteristics of "poor" and "depending on benefits." In Russia, the share of "poor" families is 60.9% of incomplete families, and the share of "benefit dependent" families is 18.9% of their number. In our study, the topic of poverty maternal families articulated by all participants in the study. The share of family and maternity allowances in the total family income and their importance for supporting families with children has significantly decreased. Natasha believes that the meager amount of the allowance and the small survivor's pension do not allow her to feed or clothe the child: “Here is my child, 3.5 years old. And, of course, the size of the allowance is small, I would like it to be more. I would be satisfied, well, at least three times more. Now - 500 rubles. I also receive a survivor's pension. The pension is also minimal - 2000, but it also counts from the length of service, a person must have 25 years of experience in order for him to have a normal pension, but how can a person who died at 25 have 25 years of experience. According to Anna, the transfer of child allowances to cards in St. Petersburg reduces the ability of mothers to buy things necessary for the child at lower prices: “The problem is that child allowances are now on the card, and not in cash. For me, this is a problem, because children's stores do not always have what you need.
Many women find it difficult to receive benefits and alimony due to lack of necessary documents, as well as the reluctance of fathers to take part in the upbringing of the child. I. E. Kalabikhina showed that the existing "inertia in the distribution of family roles, characteristic of the Soviet era, when, despite high employment, women were almost entirely responsible for raising children, and today continues to shape the relationship between fathers and children" . In Nadezhda's case, the woman cannot receive any alimony or child support because ex-husband became unemployed: “I don’t have a cash allowance, because our ex-papa doesn’t work, and
I can’t provide documents to the social security, what salary dad gets, because he doesn’t receive anything at all, there is no alimony either. ” Thus, at present, many fathers are practically freed from responsibility for the material maintenance and upbringing of children, and the state has also stepped aside from fulfilling obligations in relation to women and children.
Parents of two-parent families are more dissatisfied with the low level of wages, on which it becomes very difficult to support a family with children in the face of constant price increases. Indeed, the minimum wage is equal to 1,100 rubles from May 1, 2006. and its increase from September 2007 to 2000 rubles, which affected only the salaries of officials, covers only 30% of the subsistence level of an able-bodied person. At the same time, in accordance with Article 2 Labor Code RF “Basic principles of legal regulation of labor relations and other relations directly related to them” provides for “ensuring the right of each employee to the timely and full payment of fair wages that ensure a worthy existence for him and his family and not lower than the established federal law minimum size wages". At the same time, Russia lags behind the minimum wage standard recommended by the European Union, which is 60% of the average wage in the economy. Parents' dissatisfaction with the financial situation of the family, associated with a low level of wages in both the budgetary and commercial employment, leads to uncertainty about the future, to fears and concerns about their ability to provide for their families in the future, to educate children. The transformation of socio-economic relations under capitalism is especially painful for men who are in a state of prolonged chronic stress.
An important problem for families with children is the improvement of living conditions. The data of the Committee for Labor and Social Protection of the Population of the Administration of St. Petersburg show that as of January 1, 2007, 9,360 large families lived in the city, of which 9,030 were on the waiting list for improving housing conditions, and only 330 families did not need it. Families with many children, by law, must be provided with gratuitous subsidies for the purchase of housing, the amount of which depends on the number of children, and benefits for paying utility bills.
An analysis of the respondents' statements demonstrates an extremely unfavorable picture of the provision of housing for both large families, mothers, and complete families with children. Families' own resources are limited. Housing conditions do not meet city standards and are too slowly improved at the expense of municipal housing, and it is impossible to purchase housing with own funds. The growth of payment for housing and communal services further complicates the financial problems of large families. According to Ekaterina, parents do not have the funds to repair the apartment, equipment, household appliances, even with a strong desire it is impossible to create a normal environment for the full-fledged upbringing of children: “We are still able to feed, but there would be significant compensation at least once a year, to buy something. For example, due to the fact that the area is small, there are not enough beds¦ We are like in a compartment because of the bunk beds. Therefore, such financial assistance or furniture is needed. Or at least some organization would come to see what we need.” The consequence of chronic material distress is the lack of prospects for solving the housing problem, the inability to change living conditions, for example, to leave a communal apartment for a separate one. Lydia spoke about her difficult housing situation, which the family cannot change on its own. The family consists of nine people (two parents and 7 children different ages and floor) and occupies only two rooms in a communal apartment. Crowding, living of children of different ages and gender in one room give rise to many conflicts and quarrels, both between children and with roommates: “I have four daughters and three sons live in one room. 21, 31, 16, 8 - girls, and sons 12 and 14 - We don't get along with our neighbors. And the kids can't get along with each other. I try to please everyone, to approach. It's very hard for me".
Thus, the results of the study show that it is practically impossible to get real support from the authorities in improving the living conditions of the family. The lack of prospects in solving the housing problem stops many families from having children in the family, or forms a strategy for achieving and relying on their own strengths and means, with the risk of being left without children at all. Currently, almost half of St. Petersburg families with children (238.9 thousand families out of 490 thousand existing families) need to improve their living conditions and have been registered for more than 10 years
. It is possible to change the situation only if the state is socially responsible towards its citizens, if a policy of housing construction is pursued in the interests of families with children. As our calculations show, the construction of social housing for families with many children requires an investment of 25-30 billion rubles from the city budget, which could be done if we refuse to finance large investment projects in the interests of big businesses and monopolies and direct the money to support families with children.
"Assessment of the achievement of planned results" - Assessment is an ongoing process, naturally integrated into educational practice. Sample correct answer: 2) pit, wind, figure, yogurt. The main results of primary general education, formulated in the Requirements of the standard. READING. The role and functions of the new system for assessing the achievement of planned results.
"Material responsibility of the parties to the employment contract" - B judicial order. Types of liability. Within 1 year from the date of discovery of the damage caused. Liability is an independent type of legal liability. If the amount of recovery does not exceed the average earnings for 1 month. Grounds for bringing the parties to an employment contract to liability.
"School family" - Questionnaire. Your classmates got into a fight and are in a quarrel. My school family. Family portrait class. The essence of the problem. Your classmate receives comments in class. Epigraph. How do you understand the word "family"? What is a school family? My family. Class hour. Is our school family a fortress? What is a family for?
"Material and information models" - An even more general information model is the so-called graph structure. Presentation on the topic: "Models". Consider an example. Number of pages. Each individual characteristic that is common to all possible instances of an object is called an attribute. You can classify attributes as belonging to one of three different types: descriptive; pointing; auxiliary.
"Family" - Family photos. School. We know how to relax! A holiday for the whole family! My bookshelf. Family. Photo of a lesson in a music school. Photographs of children and parents. My hobbies. Performance in a dance group. Photos from the tour. Photo. Knowledge Day. All-Russian reading lesson. Excursion to the city of Khvalynsk.
"My family" - In his family and he is big. The whole family is together, and the soul is in place. “The surroundings of Gzhatsk were distinguished by many water meadows and forests. Reading fairy tales and family stories. In the native family and the porridge is thicker. The family is strong. A beautiful road through the forest led to the village. Goodness does not flow like a river in the world, but lives as a family.
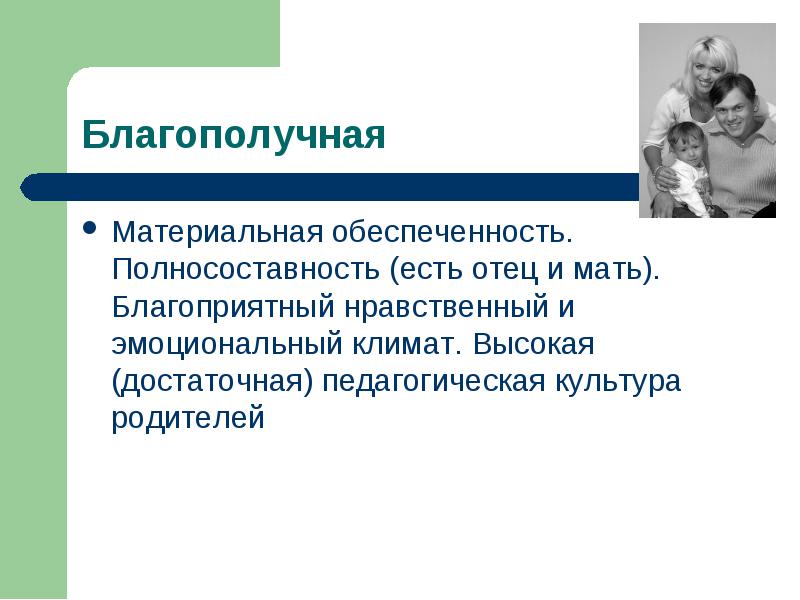
1Family types
Material security. Completeness (there is a father and mother). Favorable moral and emotional climate. High (sufficient) pedagogical culture of parents
One parent is missing from the family. The student is raised by relatives
atmosphere of discontent neurosis of one of the parents
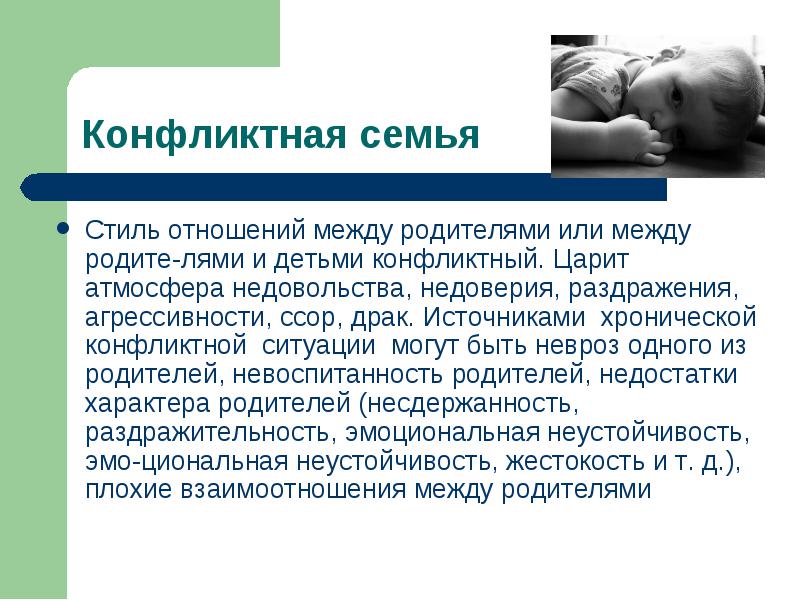
The style of relationships between parents or between parents and children is conflicting. There is an atmosphere of discontent, distrust, irritation, aggressiveness, quarrels, fights. The sources of a chronic conflict situation can be a neurosis of one of the parents, bad manners of the parents, character flaws of the parents (intemperance, irritability, emotional instability, emotional instability, cruelty, etc.), poor relationships between parents
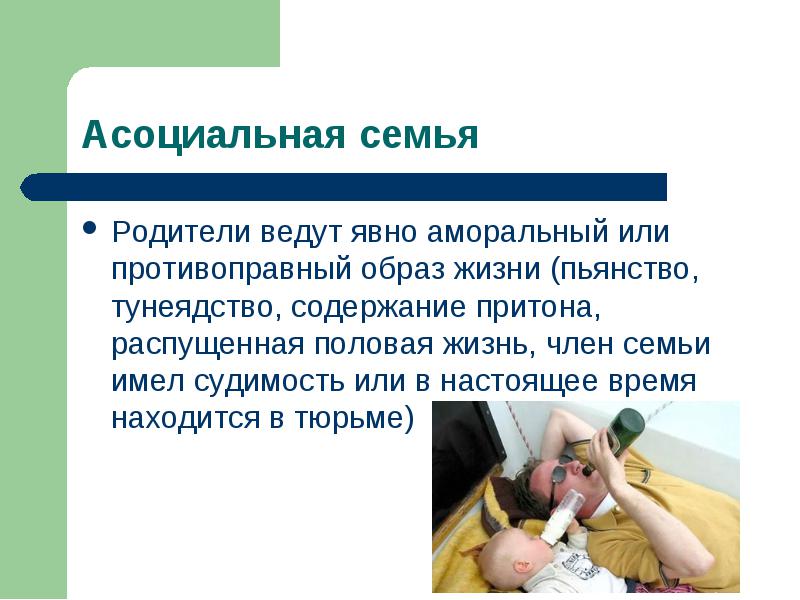
Parents lead a clearly immoral or illegal lifestyle (drunkenness, parasitism, keeping a brothel, promiscuous sex life, a family member had a criminal record or is currently in prison)
pedagogical culture
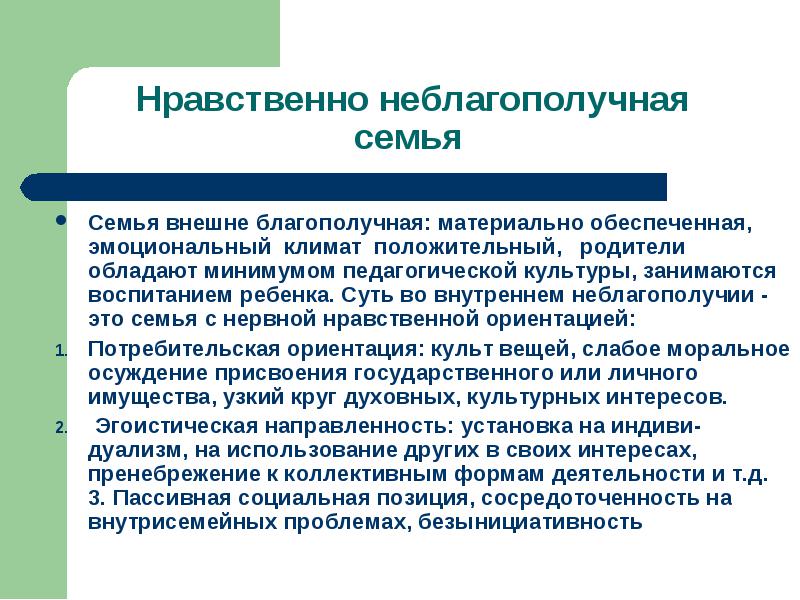
The family is outwardly prosperous: financially secure, the emotional climate is positive, parents have a minimum of pedagogical culture, they are engaged in raising a child. The essence of internal trouble is a family with a nervous moral orientation:
Consumer orientation: the cult of things, a weak moral condemnation of the appropriation of state or personal property, a narrow circle of spiritual, cultural interests.
Selfish orientation: installation on individualism, on the use of others in one's own interests, disregard for collective forms of activity, etc. 3. Passive social position, focus on family problems, lack of initiative
strict discipline connivance,
Hypersociality: increased adherence to principles, correctness, uncompromising demands, excessive prohibitions, moralizing, intolerance to weaknesses and shortcomings.
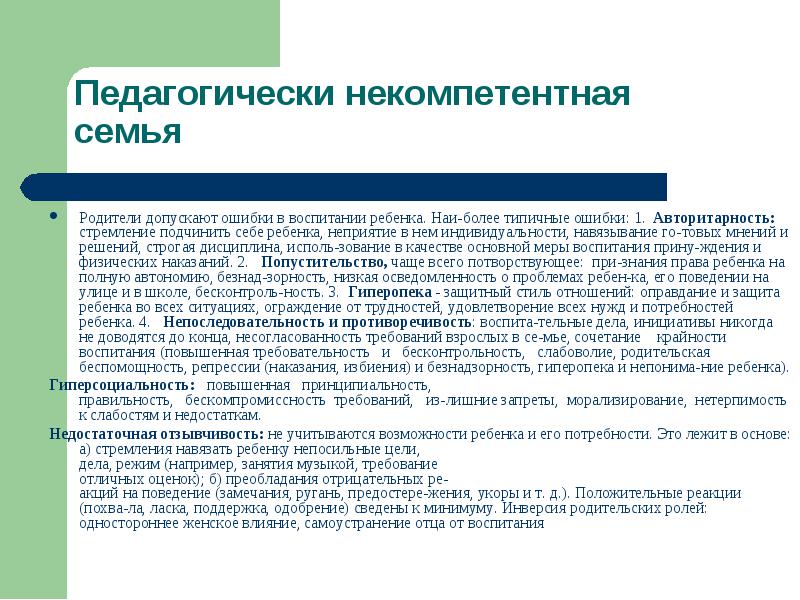
Parents make mistakes in raising a child. The most typical mistakes: 1. Authoritarianism: the desire to subjugate the child, the rejection of individuality in him, the imposition of ready-made opinions and decisions, strict discipline, the use of coercion and physical punishment as the main measure of education. 2. connivance, most often indulgent: recognition of the child's right to full autonomy, neglect, low awareness of the child's problems, his behavior on the street and at school, lack of control. 3. Hyper-custody - a protective style of relationship: justification and protection of the child in all situations, protection from difficulties, satisfaction of all the needs and needs of the child. 4. Inconsistency and inconsistency: educational affairs, initiatives are never completed, inconsistency in the requirements of adults in the family, a combination of extreme upbringing (increased exactingness and lack of control, weak will, parental helplessness, repression (punishment, beatings) and neglect, overprotection and misunderstanding of the child).
Lack of responsiveness: child's abilities and needs are not taken into account. This underlies: a) the desire to impose unbearable goals, deeds, regimen on the child (for example, music lessons, the requirement of excellent grades); b) the predominance of negative reactions to behavior (remarks, abuse, warnings, reproaches, etc.). Positive reactions (praise, affection, support, approval) are minimized. Inversion of parental roles: one-sided female influence, self-removal of the father from upbringing
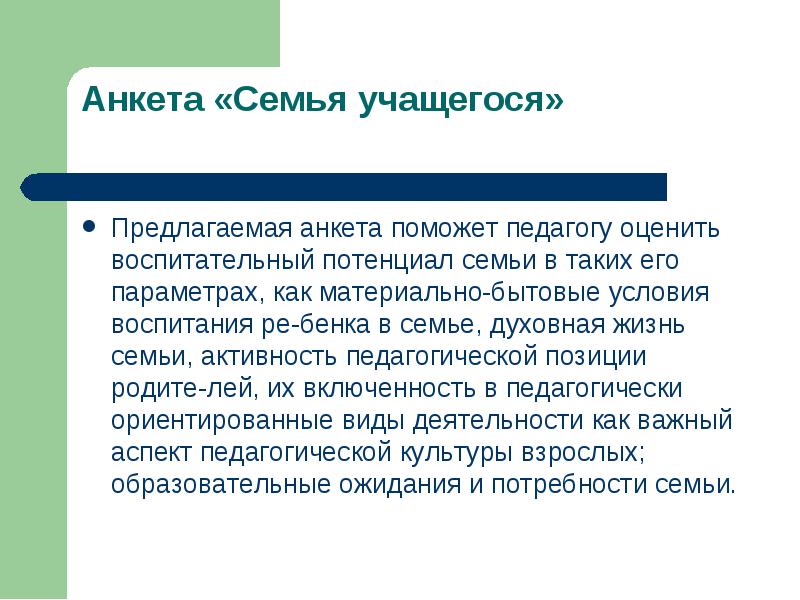
The proposed questionnaire will help the teacher assess the educational potential of the family in such parameters as the material and living conditions for raising a child in the family, the spiritual life of the family, the activity of the pedagogical position of parents, their involvement in pedagogically oriented activities as an important aspect of the pedagogical culture of adults; educational expectations and family needs.
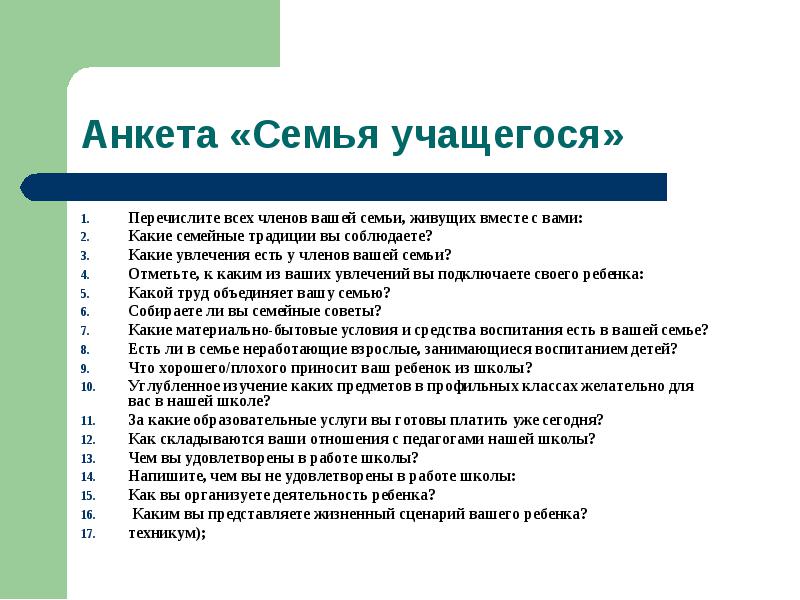
List all members of your family who live with you:
What family traditions do you follow?
What hobbies do your family members have?
Please indicate which of your hobbies you involve your child in:
What kind of work brings your family together?
What material and living conditions and means of education do you have in your family?
Are there non-working adults in the family involved in raising children?
What good/bad things does your child bring from school?
In-depth study of what subjects in specialized classes is desirable for you at our school?
What educational services are you ready to pay for today?
How is your relationship with the teachers of our school?
How satisfied are you with the school?
Write what you are not satisfied with the work of the school:
How do you organize your child's activities?
How do you imagine your child's life scenario?
technical College);
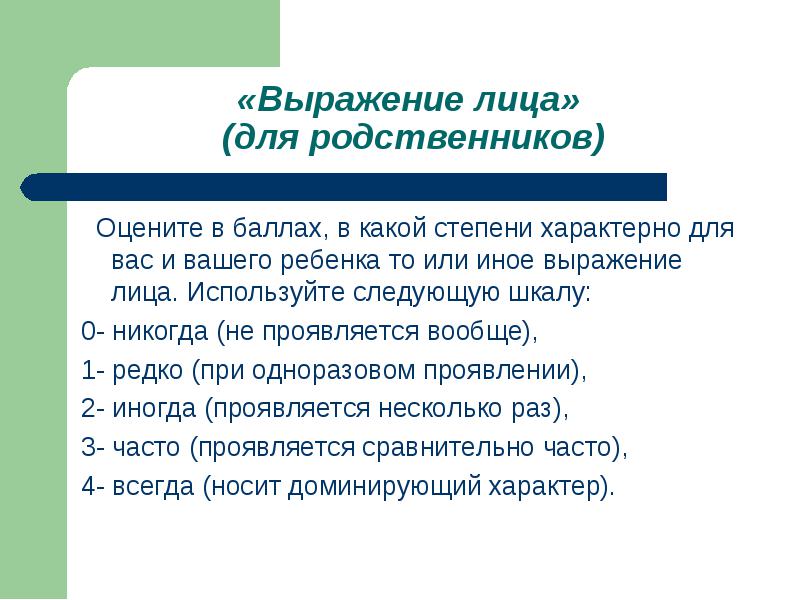
Assess in points to what extent this or that facial expression is typical for you and your child. Use the following scale:
0 - never (does not appear at all),
1 - rarely (with a one-time manifestation),
2- sometimes (appears several times),
3- often (manifested relatively often),
4- always (is dominant).
"Typical mistakes of family education" upbringing and the need for emotional contact
The child becomes the center of need, the only object of its satisfaction. Parents unconsciously struggle to preserve the object of their needs, preventing the child's emotions and attachments from going beyond the family circle.
upbringing and the need for the meaning of life
Big problems arise in communication with the child, if education has become the only activity that realizes the need for the meaning of life. The satisfaction of the need for the meaning of life can be caring for a child. A mother, father or grandmother may believe that the meaning of their existence is to care for the physical condition and upbringing of the child.
education and the need to achieve
The goal of education is to achieve what parents failed due to the lack of necessary conditions, or because they themselves were not capable and persistent enough. Such parental behavior unconsciously acquires elements of egoism for the parents themselves: “We want to shape the child in our own image, because he is the continuer of our life ...”
education as an implementation of a certain system
These are usually very competent, erudite parentswho give their children a lot of time and trouble. Having become acquainted with any educational system for various reasons, having trusted it, parents pedantically and purposefully proceed to its tireless implementation.
The main thing at the same time is that parents do not forget that not a child is for education, but education for a child.
education as the formation of certain qualities
In these cases, the parent builds his upbringing in such a way that the child is necessarily endowed with this “especially valuable” quality. For example, parents are sure that their son or daughter must be kind, erudite or courageous.
Conclusion: the overvalued motives of parents regulating upbringing limit the freedom of development of the inclinations inherent in the child, complicate development, violating its harmony, and sometimes distorting its course.
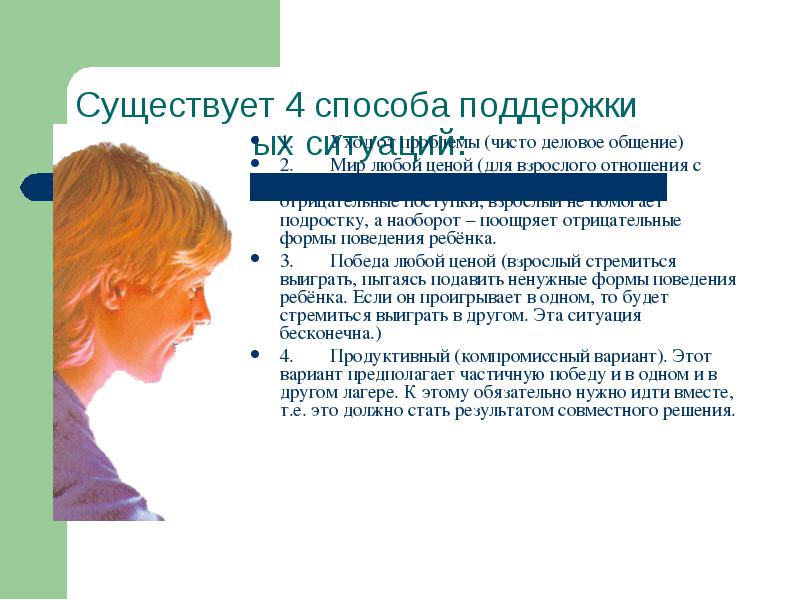
There are 4 ways to support conflict situations:
1. Avoiding the problem (purely business communication)
2. Peace at any cost (for an adult relationship with a child, the most expensive thing). Turning a blind eye to negative actions, an adult does not help a teenager, but, on the contrary, encourages negative forms of child behavior.
3. Victory at any cost (an adult strives to win, trying to suppress unnecessary forms of child behavior. If he loses in one, he will strive to win in another. This situation is endless.)
4. Productive (compromise option). This option assumes a partial victory in both camps. It is necessary to go towards this together, i.e. it should be the result of a joint decision.
Thus, in order to overcome the typical mistakes of family education, it is necessary to remember the general intra-family psychological factors that have educational value:
Take an active part in family life;
Always find time to talk with your child;
Be interested in the problems of the child, delve into all the difficulties that arise in his life and help develop his skills and talents;
Do not put pressure on the child, thereby helping him to make decisions independently;
Have an idea of the different stages in a child's life;
Respect the child's right to their own opinion;
To be able to restrain possessive instincts and treat the child as an equal partner, who simply has less life experience so far;
Respect the desire of all other family members to pursue a career and self-improvement.
understanding, generosity
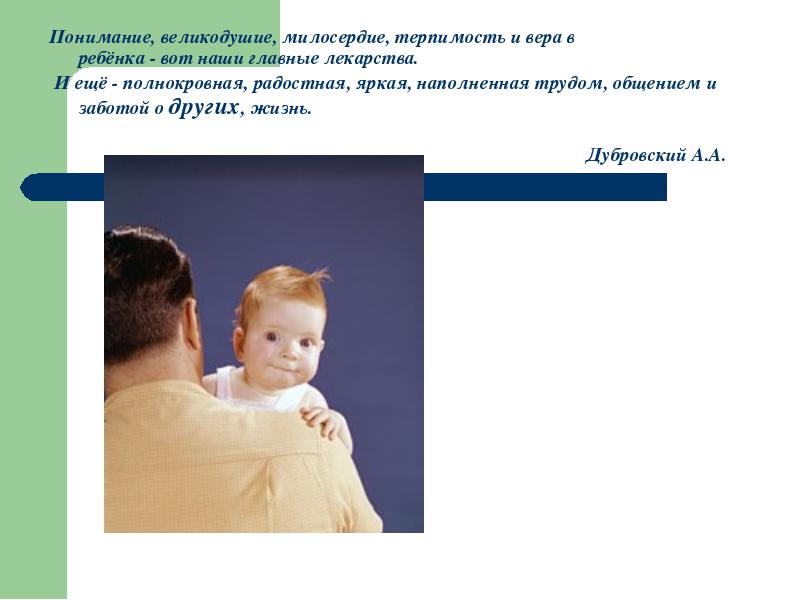
Understanding, generosity, mercy, tolerance and faith in the child - these are our main medicines.
And yet - full-blooded, joyful, bright, filled with work, communication and care for others, life.
Dubrovsky A.A.
Financial situation and living conditions as factors affecting the mobility of the Russian population
Financial situation. The analysis of the financial situation of the respondents relied, first of all, on the respondents' own assessment of their well-being. The rating was given in five positions - from those living financially “very well” (2.5%), simply “good” (19%), “average” (58.1%) to those experiencing financial difficulties (17.5%) and even “barely making ends meet” (1.8%) (Fig. 1). A small number of respondents found it difficult to attribute themselves to any of these groups (1%).
Figure 1. Assessment of the financial situation of the family
Table 1 shows the distribution of respondents in each of these groups by gender, age and education.
Table 1. Sex, age and education of respondents with different financial status, %
|
Financial situation* |
Total |
Floor |
Age |
Education |
|||||||
|
Husband. |
Female |
18-19 |
20-24 |
25-29 |
30-39 |
40-49 |
Higher and n/a |
Average |
Below the average |
||
|
We are provided with everything, we believe that we live very well |
|||||||||||
|
We live well, without any material problems |
|||||||||||
|
We live average |
|||||||||||
|
We live hard financially, we have to save on everything |
|||||||||||
|
We live very poorly, we barely make ends meet. |
|||||||||||
|
Difficult to answer |
|||||||||||
|
Total |
|||||||||||
* In further tables and figures, we do not give the full name of each group according to the questionnaire, but confine ourselves to the initial phrases: “we live very well”, “we live well”, “we live averagely”, “we live difficultly”, “we live very poorly”.
As you can see, there are no big differences in the financial situation of men and women, although women turned out to be a little poorer. The links between age and financial situation are closer: the older the respondents, the poorer they are (the share of the oldest age group among those living well is almost two times lower than that of the youngest - 14% and 27%; among the poor, the difference between them is even more significant - 2 .5 times - 24% and 9%, respectively.
The financial situation turned out to be directly related to the level of education of the respondents: the higher it is, the better the respondents live.
The data obtained were also compared with the results of the all-Russian poll conducted by Yuri Levada's Analytical Center in September 2005. The sex-age and educational patterns that we identified were fully confirmed by the data of the all-Russian survey (Table 2), and the difference in figures is most likely explained by the characteristics of the sample: we only polled the population of regional centers, and were limited to the age of up to 50 years, while the all-Russian survey covered the entire population and all ages. Apparently, in the regional centers the standard of living is significantly higher than the national average (21% of those living well versus 11% in the country as a whole; 20% of those living in poverty versus 33% in Russia).
Table 2. Financial situation based on the results of two surveys(data from the all-Russian survey by the Levada Center are given in parentheses)
|
Financial situation |
Total |
Floor |
Age |
Education |
||||
|
Husband. |
Female |
Up to 29 years old |
30-49 |
Higher and n/a |
Average |
Below the average |
||
|
We live well* |
21 (11) |
24 (11) |
19 (10) |
26 (20) |
18 (10) |
28 (16) |
18 (10) |
16 (9) |
|
We live average |
58 (55) |
57 (57) |
59 (53) |
59 (60) |
57 (57) |
56 (59) |
60 (57) |
55 (49) |
|
We live hard* |
20 (33) |
17 (30) |
21 (36) |
14 (19) |
23 (32) |
15 (24) |
21 (32) |
27 (41) |
In our study, to test the expressed subjective assessments of the financial situation, we used the answers of respondents from each of the identified five groups to specific questions related to material well-being (purchasing food without restrictions, owning a car, computer, washing machine etc.). The actual data basically confirmed the expressed subjective assessments: the percentage of those who have various material benefits decreases significantly from the first two materially prosperous groups to the middle and, then, to the two groups with material difficulties. And vice versa, the higher the respondents rate their material well-being, the lower the percentage among them who speak of any kind of deprivation. At the same time, the differences between the rich and the poor are very sharp - the shares of those who have certain material goods differ significantly! Thus, for example, among those who live well, compared with those who live hard, the share of those who buy as much meat and sausages as they want is eight times higher (90% and 11%, respectively).
The poor and even the average living cannot afford to go on vacation (in middle group about 40% did not go on vacation due to lack of funds, and in the two poor groups, this number is from 60 to 80%).
The difference between the rich and the poor is also significant in obtaining medical care. Logically, all Russian citizens should have access to free medicine under a compulsory medical insurance policy. However, the percentage of those who use it is reduced in two groups - subjectively the richest and the poorest (up to 76%; with 85% on average). Equality in this case imaginary, because among the most financially prosperous, 27% receive the missing medical care, using the services of private medicine, while among the poorest such people are three times less - only 9%. In addition, 6% of the financially prosperous use insurance paid for by the enterprise, while among the poor there are none at all. Apparently, this state of affairs further exacerbates the depth of poverty of the last group.
In general, it can be noted that for a significant part of the poor, a modern way of life is inaccessible - almost 40% of them are deprived of any material goods at all (i.e. they have no mobile phones, no washing machines, no computers, no microwave ovens , no cars, no cottages, not even just land plots for vegetable gardens).
An additional confirmation of the existence of five groups that differ in material well-being is the clearly visible difference from group to group in the share of family income that is spent on food - the corresponding question was asked to respondents (Fig. 2).
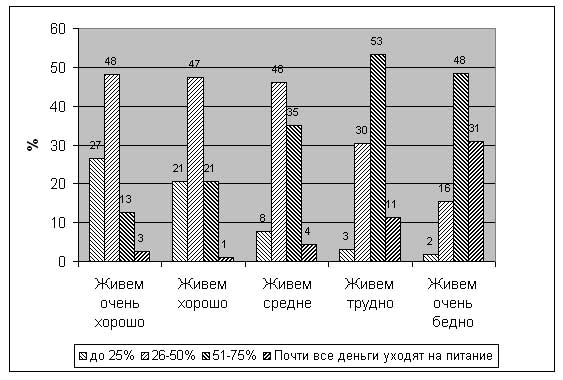
Figure 2. Percentage of family income spent on food per month, depending on the level of material well-being
These studies clearly confirm the well-known postulate that with the growth of well-being, the share of food costs in the family budget decreases.
Regional features of the financial situation of the respondents are reflected in Table 3 and Figure 3. It should be noted that in each of the cities where the survey was conducted, the number of respondents was 10 times less than the entire array, therefore, when moving to the regional level, it is advisable to reduce the number of property groups: those who live well are the respondents of the first two groups; living medium; living hard - the respondents of the last two groups.
Table 3. How would you assess the financial situation of your family?,%
|
Financial situation |
Total |
Saint Petersburg |
Novo-sibirsk |
Nizhny Novgorod |
Kazan |
Krasnodar |
Vladivostok |
Orenburg |
Belgo rod |
Smolensk |
Nalchik |
|
We live well |
21,5 |
20,9 |
25,2 |
22,2 |
27,2 |
32,8 |
21,9 |
21,4 |
10,3 |
16,9 |
15,9 |
|
We live average |
58,1 |
58,4 |
58,9 |
61,2 |
56,6 |
50,9 |
60,9 |
61,9 |
53,7 |
65,3 |
53,1 |
|
We live hard |
19,3 |
20,3 |
15,5 |
15,3 |
13,1 |
15,6 |
16,3 |
15,8 |
35,6 |
16,0 |
30,0 |
|
Welfare index* |
*the ratio of the share of the wealthy (Group 1) to the share of those experiencing material difficulties (Group 3)

Figure 3. Financial situation of the family, %
According to the welfare index, Kazan and Krasnodar turned out to be the most prosperous of all (the share of the rich is more than twice as high as the share of the poor), and the worst of all are Nalchik (the poor are twice as many as the rich) and, especially, Belgorod (the share of the poor is more than three times outnumbers the wealthy). In four more cities, the welfare index is above average - Novosibirsk, Nizhny Novgorod, Orenburg and Vladivostok (the share of the rich is 1.6-1.3 times higher than the share of the poor), and in two cities - St. Petersburg and Smolensk - the welfare index is at an average level , and the proportions of rich and poor are roughly equal.
This distribution of property by city is mainly confirmed by data on the presence or absence of material goods, as well as the share of family budget expenditures on food.
In two cities - Kazan and Nalchik - it was also possible to identify differences in the financial situation of respondents of different nationalities (the question of national self-identification was included in the questionnaire) (Fig. 4).

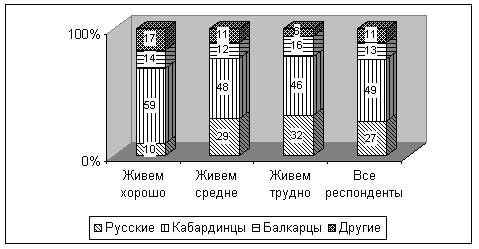
2. Nalchik
Figure 4. Financial situation of the family and nationality of the respondents, %
In Kazan, with almost the same proportion of Russians and Tatars in the sample as a whole, the group of the poor is 60% formed by Russians, while the number of Tatars in it is 2 times less - 30%. And, on the contrary, in the group of wealthy 46% Russians and 52% Tatars. The fact that the gap in this group is not very significant indicates that national discrimination in the formation of the material elite is not so high. And the fact that there are many Russians among the poor rather speaks of a different mentality, including a different attitude towards work and alcohol.
The national distribution of the poor and the rich in Nalchik tells a little about something else. Here, the main differences are revealed precisely in the group of the rich: Russians in the entire sample are 1.8 times less than Kabardians, and among the rich - 6 times (!); the proportion of Balkars in the sample is 2 times lower than Russians, and among the rich it is 1.4 times higher. This ratio clearly indicates the presence of national discrimination in the division of spheres that bring the main material income.
Final characteristics of groups of respondents with different financial status
Let us briefly formulate the features of each of the 5 groups with different material wealth.
1. “We are provided with everything, we believe that we live very well” (2.5% of respondents, 79 people). The wealthiest are the youngest (average age 29; 60% of respondents are under 30) and the most educated - half have higher and incomplete higher education (the average for the entire array is 35%). There is a noticeable predominance of men in comparison with the average for the population (in the group 57% of men and 43% of women, and the average figures for the array are 47% and 53%, respectively). In terms of marital status and the number of children, the group does not differ much from the average. The most common household size is 3 people (41% of respondents). Among the respondents in this group, the proportion of those who have no migration history and were born in the city where the survey was conducted is slightly reduced (54% versus 58% on average).
The vast majority of them have a modern way of life. Families have a car (63%), a computer (57%), a washing machine (75%), a microwave oven (67%), a mobile phone (87%). One fifth of them go on holiday abroad (the average figure is 3%), more than a quarter pay for medical services themselves. These people almost never have difficulty buying groceries and spend less than half of their family budget on food (75% of respondents).
More than half of those representing the most affluent group have a per capita income of over 6,000 rubles. They are less likely to work at a state-owned enterprise (25% of those employed, compared to 42% on average for the entire population), but they are noticeably more likely to have their own business (23% of those employed, compared to 7% on average).
2. “We live well, without any special material problems” (19% of respondents; 613 people). Representatives of this group are also relatively young, although not in the same way as in the first (average age 31, 49% under 30), and well educated (46% have higher and incomplete higher education). Men also predominate among them, although by a smaller margin (53% of men and 47% of women). Marital status, number of children, number of household members are close to average. But in terms of migration history, this group is more sedentary - 62% of respondents have never changed their place of residence.
Representatives of this group also have basic material goods, although compared to the richest, the level of saturation with them is slightly lower: 57% have a car in the family, 56% have a computer, 77% - washing machine, 58% - microwave oven, 85% - mobile phone. They are less likely than the wealthiest to go on vacation in Russia and abroad (15% and 7%), but these figures are much higher than the average (7% and 2%). A quarter of them can afford to pay for medical services themselves.
In terms of food consumption, this group is not much different from the first - 90% buy meat as much as they want, and in general, 68% of them spend less than half of the family budget on food. However, in this group, the proportion of those who “eat up” from half to three-quarters of the budget is already quite numerous - 21%.
Per capita income is noticeably lower - 61% limited it to between 3,000 and 10,000 rubles. Compared with the wealthiest respondents in this group, they are almost twice as likely to have their own business (12% versus 23%), but almost twice as likely to use the help of relatives and friends (10% versus 5%).
3. “We live average” (58.1% of respondents, 1871 people). The largest group, which fully justifies its name, because. its characteristics almost always correspond to the average for the entire array. Average age respondents aged 33; 42% are under 30 years old, 26% are from 30 to 40 years old, 31% are from 40 to 49 years old. Higher and incomplete higher education in 34% of respondents; there are also numerous shares of those with secondary specialized and complete secondary education (28% each). The ratio of men and women is close to the average (46% of men and 53% of women). Most households consist of three people (34%), but those with 4 people (28%) are approaching them in number. Marital status and the number of children at the average level (33% single and 54% married; 37% with one child and 14% with two). This group is also average in terms of the number of those who moved - 58% were born and did not leave their city anywhere.
In this group, the proportion of those whose life is saturated with modern objects is already noticeably lower. Only a third has a car in the family (more than 20% - a used one), 33% - a computer, 58% - a washing machine, 36% - a microwave oven, 74% - a mobile phone. They almost never go on vacation abroad and travel less frequently in Russia (2% and 7%, respectively). Only 18% of them can afford to pay for medical services themselves.
Only half of the “middle living” do not deny themselves the purchase of meat products, and in general, the majority spends on food from a quarter to three quarters of the family budget - 81%.
The income of the majority of representatives of the middle group (74%) lies in the range from 1,000 to 6,000 rubles. The main part lives on income from wages at their main place of work, but compared to well-to-do groups, the share of those receiving various pensions (18%) is growing significantly.
4. “We live hard financially, we have to save on everything” (17.5% of respondents, 565 people). In this group, most of the property indicators are significantly lower and lag behind the average level to the same extent that it is exceeded in the first two wealthy groups. The respondents in this group are older - the average age is 36 years (less than 30% are under 30 years old, but 42% are over 40 years old). Less than a third have a higher and incomplete higher education, 30% have a specialized secondary education, 28% have a complete secondary education, and already 14% have an incomplete secondary education (less than 10% of such people in the previous group, and only 5% among the wealthy). The proportion of women is growing noticeably - 59% versus 41% of men. Among the features of the group is a smaller proportion of singles - 26% (against 33% of the average), but an increased proportion of widowed and divorced (5% and 14%, respectively). Thus, the family situation in a significant number of respondents is clearly less favorable than in the previous three groups. Respondents in this group are champions in terms of the proportion of families with children - only 41% do not have children under 18 (against 50-54% in wealthy groups). Most families with one child (41%), but at the same time, the proportion of families with many children (three or more children) exceeds the average by more than two times (5% with an average of 2%). These figures once again confirm the conclusion made by researchers of poverty problems in Russia, who conclude that “the largest group of the poor is families with children; …they make up 50-60% of the total number of poor families” .
Representatives of this group have the richest migration history - only 51% of them have never moved anywhere (against 58% on average).
The percentage of those who own modern household items among the respondents of the group is sharply reduced: only a fifth of them own a car (more than half of them are used), 19% own a computer, 38% a washing machine, 17% a microwave oven, 52% a mobile phone. They rarely go on vacation both in Russia and abroad (3% and 2%, respectively). But at the same time, 16% are forced to pay for medical services on their own. The situation with food purchases is even worse: only 11% buy plenty of meat and meat products; 84% spend on food from a quarter to three quarters of the family budget, and 11% spend all their money on food.
In terms of income, 81% fall into the gradation from 1,000 to 6,000 rubles, with the vast majority (56%) falling into its lower limit - from 1,000 to 3,000 rubles. A tenth of them generally live on less than 1,000 rubles a month. Among the sources of income, the role of pensions (29% against an average of 18%) and benefits (14% against an average of 10%) is increasing.
5. “We live very poorly, we can barely make ends meet” (2% of respondents; 58 people). The poorest and smallest group.
The average age is 35 years, and all age intervals (up to 30, up to 40, up to 50 years) are represented almost equally (33-34%). Respondents are the least educated - only 19% have higher and incomplete higher education and the same number do not have complete secondary education. Interestingly, the ratio of men and women completely repeats the structure of the wealthiest group - 57% of men and 43% of women. The most common household size, as in other groups, is 3 people (26% of respondents), but at the same time, the proportion of people living in twos (22.4% with an average of 17.5%) and one (17% with averages) has significantly increased. 8%). The marital status of the respondents also differs from the average - only 34% are married (against 53% on average), the maximum share of divorced is 19% (against 8% on average) and increased widowed - 3.5% (against 2% average). Thus, as in the previous group, the family situation is not too favorable. Exactly half of the families do not have children under 18 years of age, and a feature of the second half is the increased proportion of families with many children (8% against 2% in the entire population).
The poorest - the most sedentary - 66% have never moved anywhere in their lives.
The household items listed by us are even rarer than in the previous group: 22% own a car (12% - used), 16% - a computer, 19% - a washing machine, 14% - a microwave oven, 35% - a mobile phone. No one went abroad to rest, and in Russia only 3%. Medical services self-pay 9%.
Half of the representatives of this group very rarely allow themselves to buy meat and sausages, because. there is not enough money for this (only 3% of such people in the middle group). In general, 79% spend more than half of their family budget on food, and a third of the respondents spend all their money on food.
Two-thirds of the respondents in this group live on incomes of less than 3,000 rubles per person per month (while a third live on less than 1,000 rubles). About a third of the poorest households do not have a main employment source of income, and among the respondents themselves, half do not work at all (with an average of 30%). At the same time, there are significantly more people living on income from pensions - 29% (average - 18%), benefits - 19% (10%) and receiving cash aid from relatives and friends – 19% (10%). Those who work themselves, much more often than representatives of other groups, work by verbal agreement and receive wages completely unofficially (32%, with an average of 9%).
Thus, the subjective distribution of respondents in five different groups material security received a fairly solid factual confirmation in the analysis of all property, and in part, gender and age, educational, labor and other indicators. The confirmed representativeness of the data will allow us in the future, when characterizing the migration mobility of the population, to rely on these property groups.
Financial situation and mobility . Let's see if there is a difference in the migration intentions of respondents with different material wealth (Table 4).
Table 4. Financial situation and migration intentions, %
|
Yes, I definitely decided to move and take active steps |
I'm about to move but haven't done anything yet |
Sometimes I think about moving |
I would like to leave for a while (no more than a year) |
I don't want to and don't want to move. |
Didn't think about it |
|
|
We live well* |
62,9 |
27,2 |
||||
|
We live average |
61,2 |
27,4 |
||||
|
We live hard* |
60,4 |
24,7 |
||||
|
All |
61,3 |
27,0 |
*The table combines the first two positions (“we live very well” and “we live well”) and the last two positions (“we live hard” and “we live very poorly”).
As you can see, the difference between the groups is very small, although the overwhelming majority of representatives of any group are not in the mood to move. The wealthy are more active in real actions, but less in intentions. The Difficult Living group is more considering the possibility of moving, but so far only in theory. In addition, the share of those wishing to work temporarily is twice as high (the well-to-do need it to a much lesser extent).
Comparison of migration mobility (both real and potential) of poor and rich residents of 10 regional centers demonstrates a greater diversity of positions. And although in most cities the mood and not the mood to move are also characteristic of all groups of the population to approximately the same extent, regardless of their financial situation, there are still exceptions. Thus, the two clear "migration" leaders among the cities - Nalchik and Vladivostok - differ quite significantly from each other in the approaches of the rich and the poor to migration. If in Nalchik the share of the poor who have migration intentions slightly exceeds the share of the rich planning to move - by only 6%, then in Vladivostok this difference is almost two times (31 and 16%, respectively). And in Smolensk, which ranks third in terms of migration sentiments of the population, on the contrary, the rich are much more active (22% versus 10%). We can also note the complete absence of migration activity among wealthy residents of Nizhny Novgorod and Belgorod (0%) and the extremely low level of mobility among poor residents of Kazan (2%).
In general, the hierarchy of regional centers in terms of migration mobility is not so directly related to their classification according to the welfare index. For example, two "poor" cities - Nalchik and Belgorod - demonstrate a radically different attitude towards migration (respectively, 24 and 6% of those with migration intentions); Smolensk and St. Petersburg, which are close in terms of the welfare index, differ more than twice in terms of the level of migration mobility (15 and 7%, respectively); Vladivostok, which is approximately equal to Nizhny Novgorod in terms of the well-being of residents, is more than 5 times higher in terms of the population's attitude towards migration (22% versus 4%). To a greater extent, migration mobility turned out to be associated with the integral assessment of their cities by the respondents, expressed in the share of those satisfied with life in them (Fig. 5).
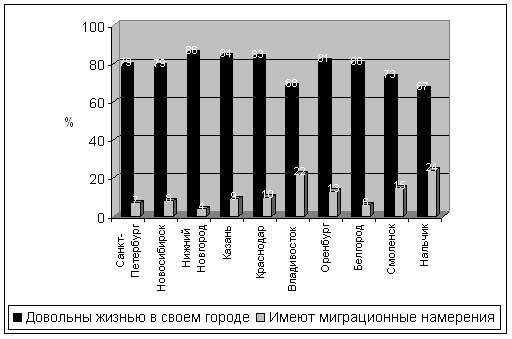
Figure 5. Satisfied with life in their city and having migration intentions, %
At least for leaders and outsiders, the correlation is inverse, and very close: where the proportion of those who are satisfied with life is the lowest (Nalchik, Vladivostok, Smolensk), there is the highest mood for migration; and vice versa in Nizhny Novgorod the most satisfied with life (86%) and least of all aimed at moving.
If, in general, the migration intentions of the poor and the rich across the array differ slightly, then the differences in the reasons for the emergence of plans to move are more significant. For the wealthy, they are largely related to family circumstances: 22% are going to leave for relatives, 33% - to move for "other reasons" not related to work, housing, education, and only 32% - due to the fact that there is no good work, 7% - because of poor housing. At the same time, among those living in difficulty, 50% of the reasons for leaving were the lack of work, 25% - poor housing, and only 16% - family reasons, and 15% - "other reasons".
A comparison of responses to a hypothetical offer of work and housing in another city also shows the difference between the approaches of non-working respondents living in wealthy and poor families: 23% of the wealthy would move, and 54% of them answered “no” or “rather not”; the poor have a slightly different ratio - 27% and 40%, respectively. And in the middle group in terms of wealth, in general, there were equally divided answers "yes" and "no" - 34% each.
Low migration mobility can also be seen in the answers about the future education of children: 60% would like their children to study in their city (I remind you that 61% are not going to move themselves). At the same time, those who are wealthy are even more willing to keep their children with them – 64%. Only 4% are ready to send their children to study in another city in Russia and 5% - abroad. The poor here were ahead - among them, 7% admit options for studying abroad. At the same time, the wealthy are more inclined to insist on their decision - only 16% left the right of choice to children (on average - 23%). Thus, the educational mobility of children is unlikely to be high.
A similar picture is in the choice of parents of the future place of residence of their children: 62% preferred that their children live in their city or nearby (among those who answered specifically “in our city”, the percentage of wealthy is slightly higher - 48% versus 42% of those living in poverty.
In the approach to the education of children and the choice of their place of residence, the respondents of Nalchik stand somewhat apart. When asked to spend a hypothetical winning of 600 thousand rubles, 22% of Nalchik residents answered that they would use it to educate their children (against 14% on average in all cities). The proportion of those who answered in this way is especially high among poor respondents in Nalchik - 30% against 17% on average for the array. At the same time, residents of Nalchik count on their city as a future place for children to receive education much less than others - only 20% of the well-to-do, 36% of those living on average and 45% of the poor would like their children to study in their city (average figures for cities are 64%, 59% and 60%, respectively).
The agreement or disagreement expressed by the respondents with the statements he proposed regarding migration showed a clear predominance, if not negative, then at least a wary attitude, both towards the migration process itself and towards those who move a lot (Table 5).
Table 5. Perspectives on migration and migrants by wealth, in %
|
Statements |
We live well |
We live average |
We live hard |
All |
||||
|
Agree |
Don't agree |
Agree |
Don't agree |
Agree |
Don't agree |
Agree |
Don't agree |
|
|
You need to live where you were born and raised, where relatives and friends live |
||||||||
|
Everywhere is the same, so you should not look for the best |
||||||||
|
Who moves a lot from place to place - people without roots, they can't get along anywhere |
||||||||
|
Moving people bring "disturbance" to society, there should be as few of them as possible |
||||||||
|
The most active and those who seek to improve their situation move |
||||||||
|
We need to move more, look for a place where it is better to live |
||||||||
|
I don't care where I live, the main thing is to be good job and normal living conditions |
||||||||
As you can see, there are almost no special differences in the answers of respondents with different levels of prosperity, and this means that a consensus has been developed in society in relation to migration. But still it is worth noting that the poor in their views are a little more conservative and less inclined to change something in their lives.
Almost equally poor and rich treat visitors. The only difference is that the poor are more likely to express a negative attitude towards them (12% versus 6% of the rich). It is quite possible that this is due to competition for jobs, which, if it exists, is only for those occupied by the poorest segments of the population.
The same reaction of both the poor and the rich was caused by the question: “do those who change their place of residence from time to time live better or worse than the rest of the population?” More than 60% answered “who is like”, i.e. they did not see any real gain or loss in the situation of the migrants around them.
Summarize. Despite the general proximity of the views of all respondents on migration, the financial situation still leaves its mark. In general, the less affluent respondents turned out to be more conservative in their views, they consider migration to a lesser extent a way to improve their lives (40% among them believe that “everywhere is the same”, and 63% - that “one should live where was born”; among the wealthy, 32% and 54%, respectively, think so). This position of the poor is also confirmed by other questions of the questionnaire, in particular, the choice of reasons for not wanting to look for work outside their city: the reason “I don’t believe that it will be better somewhere” was chosen by 27% of the unemployed poor and only 11% of the unemployed, but living in wealthy families.
So, the main conclusion that can be drawn after studying the relationship between the financial situation and migration mobility is as follows: with a very low level of migration mobility of the population as a whole, the difference between people of different material wealth in approaches to migration is not very large, but still exists. Those who are actually preparing for the move are those who are better off, and those who are experiencing financial difficulties are more likely to think about migration. But, given the fact that the wealthy are more likely to move for personal reasons not related to work, housing, etc., the developers policies that promote the growth of migration mobility of the labor force should be more oriented towards the less well-off segments of the population who are thinking about migration, but due to their conservatism and poverty are not ready to make a decision. It is necessary to influence their views, to convince them that "to look for a better O it”, to create a positive image of a migrant as an active, purposeful person who achieves his goals, and in addition, to help with loans. This group is more than others interested in material incentives - good earnings (60% of the poor would like to move based on them), housing (30% of the poor looked for work only in their city, because there is nowhere else to live) , lifting (14% did not look for work in other places, because there is no money to move).
Living conditions . Self-assessments of the material well-being of the respondents are quite consistent with the difference in their housing conditions (Table 6).
Table 6. Financial situation and occupied housing, %
|
Financial situation |
Own separate apartment or house (part of the house) |
Non-private Department. Apartment |
Room(s) in commun. quart.* |
We live in my parents' apartment |
In a hostel or services. housing |
With relatives, friends |
We rent housing |
Total |
|
We live very well |
87,4 |
|||||||
|
We live well |
70,8 |
13,4 |
||||||
|
We live average |
61,1 |
14,7 |
||||||
|
We live hard |
56,3 |
13,5 |
14,2 |
|||||
|
We live very poorly |
55,2 |
15,5 |
||||||
|
All respondents |
62,7 |
13,9 |
* Privatized and non-privatized approximately equally
The main watershed is the attitude of respondents to the ownership of occupied housing: among the “richest” almost 90% are owners of their own housing, and among the “poorest” only 55% are. At the same time, material security is also manifested in whether this housing is separate or not, but here the differences are significantly reduced, because. low-income people often live in separate, but not privatized apartments (almost 16%, against 1% in the group of the most affluent). Among other features of the low-income group is the largest share of those living in a hostel (although in itself it is small - 5%) and relatives and friends who use housing (7%). Renting a house turned out to be practically unrelated to the income of the respondents (the share of renters in each group is approximately the same - 6-7%; we did not take into account the quality of rented housing), but at the same time, a close dependence of the share of renters on the time of arrival in a given settlement was revealed - among those , who arrived in the last 5 years, rented housing is used by 2 times more respondents - 10-13%.
For a quarter of respondents in the wealthiest group, the housing they live in is not the only property they own. In the second and third groups, there are 15 and 9% of such people, respectively, and in the two subjectively poor - 6-7%.
People standing on different rungs of the “material” ladder have different dwellings, not only in type, but also in quality. This is evidenced by indicators such as the number of square meters per person and the degree of satisfaction with their living conditions.
According to the 2002 census, the average area per Russian was 19 sq. meters. In our study, the average is much lower - 15.7 square meters. meters, which is apparently due to the absence in the sample of pensioners and villagers, whose housing area is usually higher.
The number of square meters per person varies from 13 for the poorest to 20 for the richest. The degree of satisfaction with their housing changes even more dramatically: from 17% satisfied in the low-income group to 82% in the group with the highest income. The percentage of those who are dissatisfied changes in the reverse order: from 57% in the low-income group to 2.5% among the financially well off.
a brief description of living conditions of the respondents of each of the groups, differing in financial situation, is as follows:
"Provided for everyone" - almost 90% are owners of their own housing, and high-quality housing - a separate apartment or house (part of the house), where on average more than 20 square meters per person. meters. Naturally, such living conditions cause satisfaction among the respondents themselves - 82% of them are satisfied with their housing, and for a quarter of the respondents in this group it is not the only one.
“We live well” - 71% own a separate apartment or a house (part of a house). Compared to the first group, there are more owners of non-privatized separate apartments (5% vs. 1%) and those living with their parents (13% vs. 4%). On average, there are already 18 square meters per person. meters of the total area, and the percentage of those who are completely satisfied with the quality of their housing is decreasing (up to 62%). Real estate is not the only one for 15% of respondents.
“We live average” - 61% live in a separate privatized housing and 10% in a separate non-privatized one. Almost 15% live with their parents. One person has 15.2 sq. meters of total area, and only 41% are satisfied with the quality of their housing. Additional real estate in the city is owned by 9% of respondents.
“We live hard” - 56% have their own separate housing, another 13.5% live in a separate non-privatized housing, and 14% live with their parents. One person has 14.4 square meters. meters of the total area, and the share of those satisfied with the quality of housing does not reach even a quarter of the number of respondents included in this group. Only 6% own additional real estate.
“We live very poorly” - 55% have their own separate housing, another 16% live in a separate non-privatized one. Few people live with their parents (only 5%), but the share of those living in a hostel (5% against an average of 1.7%) and with relatives or friends (7% against an average of 1.5%) has increased. One person has only 13 square meters. meters of total area (the smallest value among all groups), and the share of those satisfied with the quality of housing is also the smallest - 17%. Additional real estate is owned by 7% of respondents.
Housing conditions differ not only among groups of respondents with different financial status, but also vary quite significantly in the cities in which the survey was conducted (Table 7).
Table 7. Housing conditions by survey cities
|
Total |
Saint Petersburg |
Novo-sibirsk |
Nizhny Novgorod |
Kazan |
Krasnodar |
Vladivostok |
Orenburg |
Bel-gorod |
Smolensk |
Nalchik |
|
|
Percentage of homeowners |
|||||||||||
|
Percentage of renters |
|||||||||||
|
Percentage of satisfied housing |
|||||||||||
|
Number of square meters per capita |
15,7 |
16,6 |
13,7 |
14,6 |
15,4 |
18,5 |
14,0 |
16,9 |
15,2 |
14,5 |
18,4 |
In terms of the share of owners, four cities are clearly in the lead - Nalchik, Orenburg, Krasnodar and Kazan, and four cities are noticeably behind - St. Petersburg, Novosibirsk, Nizhny Novgorod and Belgorod. In terms of the size of the total area per person, the picture is already somewhat different: Nalchik, Krasnodar and Orenburg remain in the lead, while Kazan takes the place of St. Petersburg (16.6 square meters with 15.7 on average). Novosibirsk, Nizhny Novgorod and Belgorod lag behind in this indicator too (the minimum provision in Novosibirsk is 13.7 square meters); in addition, the size of housing per person is close to the minimum in Vladivostok and Smolensk. The share of rented housing varies little by city, with the exception of two extremes - Kazan, where only 3% of renters, with 7% on average, and Vladivostok, where, on the contrary, 13% of respondents use rented housing. The most interesting thing is that the degree of satisfaction with housing in cities is not directly related to real housing conditions. Thus, the above fully explains the low percentage of those satisfied with their housing in Novosibirsk and Vladivostok (35% each, with 43% on average) and the high percentage in Orenburg (54%). But at the same time, the highest share of satisfied people - 58% - falls on not the most prosperous Kazan, but a rather low rate of satisfaction - 38% - on the most prosperous Nalchik. Apparently, this figure is still largely associated with overestimated or underestimated living standards in a particular city.
Housing conditions and mobility . In order to analyze the impact of housing conditions on the migration mobility of the population, we first turn to the real experience of migrants, recorded in the answers to the questions of the questionnaire. First of all, it shows how the value changes housing issue for migrants at every stage of the journey. Only 3% thought about the housing problem and named it among the reasons for making the decision to move to this city; already 7%, when choosing their current place of residence, expected to solve housing among the three main problems; and finally, 22% cited it as one of the top three challenges in a new job. Thus, there is an underestimation by migrants of the importance of this problem at the decision-making stage.
Let's see how the housing problem was ultimately solved after moving to the surveyed cities (Table 8).
Table 8. Types of housing for the relocated and settled population
|
Own separate apartment or house (part of the house) |
Non-private Department. apartment |
In the apartment of the parents of the husband / wife |
In dorm |
service housing |
We rent housing |
With relatives, friends |
|
|
Moved to the old place |
50,6 |
19,7 |
12,7 |
||||
|
Moving to a new place |
59,9 |
12,1 |
|||||
|
Never moved |
64,8 |
16,9 |
|||||
|
All population |
62,7 |
13,9 |
As we can see, the bulk of those who moved were able to improve their living conditions, although migrants are still in a slightly worse situation compared to the local population who did not move (the gap roughly corresponds to the difference in the financial situation of those who moved and those who did not move). Noteworthy is the large percentage of migrants who rent housing, but these are mainly those who have moved in recent years (80% since 1998) and have not yet managed to acquire real estate. In general, we can talk about the positive role of moving in terms of solving the housing problem..
The type of property a family currently occupies has a significant impact on its migration activity. Most people are satisfied only with their own housing, and those living in other conditions are more likely to move. 27% of those living in service housing (with an average of 11%), 20% of those renting housing, 19% of those living with relatives and 15% of those living with their parents had some migration intentions. Together, these categories of respondents represent about a quarter of residents of regional centers aged 18-50.
The push function of poor-quality and insufficient-sized housing does not manifest itself at the level of consideration of average indicators (62% of those living in such housing are not going to move, while 61% on average). There are very few differences in the migration intentions of those who are generally satisfied with and dissatisfied with their living conditions: respectively, 10 and 13% of them are to some extent inclined to move. This is probably because the housing factor affects mobility in combination with other factors, and the same balance can be formed with different combinations of their impact strength. On the other hand, when the intention to move already arises (quite possibly for a completely different reason, and not because of housing), then the role of housing becomes very clear. Among the top three reasons for deciding to leave, poor housing and the inability to improve it were named by 15% of respondents, and 21% said that in a new place they are most attracted by the opportunity to improve their living conditions.
The underestimation of the role of housing by respondents in determining the reasons for making a decision to move is also evidenced by the high proportion of those who would expect to spend a hypothetical gain of 600,000 rubles specifically on housing. From 30 to 40%, depending on the city, would spend their winnings specifically on solving the housing problem, and in some cities the rich are going to do this even more than the poor (for example, in St. Petersburg and Nizhny Novgorod). In fact, the housing problem has been solved only for a layer of wealthy residents of Nalchik (only 12% would spend their winnings on housing). The table demonstrates the true role of housing in the lives of residents of Russian regional centers, but most understand that simply moving cannot solve the problem, so most often people go to earn money in order to improve their housing later.
An indirect confirmation of this conclusion is the revealed relationship between migration intentions and intentions to improve housing. Among those who are firmly planning to improve their living conditions in the near future, the share of those who actually intend to move is twice as high (2.6% versus 1.3% of those who do not plan to improve their housing) and significantly less of those who are not at all relocation (57% versus 65%). In general, a fifth of those planning to improve their housing conditions do not exclude the possibility of doing this in another city (among those who do not plan to improve their housing, only 8% do so). .
Main conclusion: in themselves, poor living conditions and dissatisfaction with housing do not serve as the main push factor, but are taken into account by people (sometimes even implicitly) when making a decision to move, and at each subsequent stage of preparation for migration to an increasing extent. It follows from this that a policy that stimulates migration activity must necessarily appeal to people's desire to improve their housing, demonstrating to them the positive experience of solving this problem by other migrants. Perhaps information about any housing benefits at a new place of residence (where the state wants to direct migration flows) should be disseminated, including through real estate companies, because. this is where people who plan to improve their housing go, and among them there is a large proportion of those who do not associate this improvement exclusively with their current city.
The study "Problems of territorial mobility in Russia" was conducted under the leadership of Zh.A. Zaionchkovskaya within the framework of the project of the Ministry of Economic Development of Russia and the Center for Migration Research. For the study, a sample with a total volume of 3200 respondents was designed, representing the population of regional centers of 10 regions of the Russian Federation aged 18 to 49 (full) years.
Bulletin of public opinion. No. 6 (80). November - December 2005
Ovcharova L. Profile of Russian poverty / Population and society. No. 89. May 2005
According to NOBUS, 26.0% of households in Russia are classified as poor, with a significant part of them concentrated near the poverty line, and only for a tenth of them poverty means practically no means of subsistence [Ovcharova L. Profile of Russian poverty / Population and society. No. 89. May 2005]. This actually coincides with the results of this study, where the proportion of the poor is 20%, of which 2% "barely make ends meet."
In the conditions of market relations, the family becomes a subject of microeconomics, is considered as a kind of economic unit of the state, which consumes resources, including labor within the country and goods on the market, produces goods to meet its needs, and incurs certain costs. This basically determines its economic behavior. The family is not only an important consumer, but also a producer.
Nevertheless, the family still occupies much less space in economic analysis than in real life. The theorists of the past did not give the family the attention it deserved. The exception was T. Malthus' (1766-1834) population growth model, which touched on the relationship between fertility, family income and marriageable age: under less favorable economic conditions, as he argued, people usually start a family later (or should do so).
A serious contribution to the study of the emergence and development of the family was made by the work of F. Engels (1820-1895), written in 1884, "The Origin of the Family, Private Property and the State."
The family is the primary unit of society in microeconomics. Not without reason, in 1992, the Nobel Prize for achievements in the field of economic sciences was awarded to University of Chicago professor G. Bocker for "expanding the scope of microeconomic analysis", which showed in his writings how economic factors control the formation of a family.
Family life is characterized by various material (biological, economic) and spiritual (moral, psychological, aesthetic) processes. It reflects the strength and weakness of the social well-being of society, because it is a consciously organized group for the implementation of socio-economic and spiritual interests.
Throughout the civilized world, the right of the family to be protected by society and the state is recognized. The family has long been the central unit in demography, and in the economy it has receded into the background. But the family is the system most adapted to influence society as a whole, increasing its wealth.
According to research by VTsIOM (All-Russian Center for the Study of Public Opinion), according to the majority, happiness in family life depends on two main reasons: material well-being(55% of respondents) and relations between spouses (59% of respondents). Let us add to this that the same material support of the family often has a decisive influence on the relationship of spouses.
The contradictions of modern society, all its problems and difficulties primarily affect the family. In the conditions of market relations, when the basis of the state concept social protection of the population, the creation of conditions for self-sufficiency comes to the fore, the family becomes, in essence, the only main guarantor of survival, since nowhere, except in the family, it is impossible to satisfy everyday needs.
During the economic crisis, the family becomes a microeconomic unit of society. Its economic isolation is taking place, the economic function of the family is growing and transforming in the direction of acquiring and creating property, accumulating and inheriting family wealth. The very concept of "economics" originally meant "the art of housekeeping."
The socio-economic changes that are taking place in our society greatly increase the role of the economic function of the family.
The economic function of the family (the function of the formation and accumulation of human capital) is one of the main ones. But if earlier the concept of “economic function” was mainly invested in ensuring consumer interests and meeting the needs of family members, now there has been an economic isolation of the family, and a change in property relations and forms of management has necessitated the emergence of an independent business in each family.
In today's economy, the family is seen as more than just an important consumer. The family runs a household (this is a socio-economic unit that unites people in relation to the organization of their joint life). According to the UN definition, a household is based on a way of life in which individuals or groups of individuals provide themselves with food and everything necessary for life. In a market economy, a family is an economic unit consisting of one or more persons. She accepts independent solutions, is the owner of a factor of production (most often - the labor force).
The implementation of the economic function of the family is influenced, on the one hand, by the system of socio-economic needs, value attitudes and orientations, life goals and ideals of society, on the other hand, by the subjective characteristics of family members, their inclinations, personality, consumer needs, level of cultural development, national and ethnic features.
The reproduction of a person as a person means raising him in the family not as an infantile consumer, but as a worker, relying primarily on himself. This means preparing children for work, vocational guidance and economic education, and the formation of the master of one's life.
Various directions of economic function are closely connected and interdependent. Each of them characterizes a specific aspect of the family economy. The family solves various problems of family business, housekeeping, production and reproduction of the labor force, ensuring the necessary level of consumer demand, creating investment capital, etc. (see Fig. 2).
Thus, in a market economy, two blocks can be distinguished in the structure of the economic function of the family: 1)
participation of the family in the social division of labor in order to form the family budget, provide new needs and opportunities for the family, normal living conditions and social support for minors and its disabled members; 2)
distribution of roles in the process of housekeeping (household services for family members, organization of the consumption process).
From the point of view of the economy, the family is, as a rule, consciously organized on the basis of family ties and common life. small group people whose life activity is carried out to meet the social, economic and spiritual needs of the individual, the family itself and society as a whole. The family is an independent economic unit: it makes independent decisions, is the owner of a factor of production (most often, the labor force).
The family is the main link in the formation and accumulation of "human capital", so the system of family functions can be
Rice. 2. The structure of the economic function of the family
consider at three stages: education, production and implementation of "human capital". 1.
The formation of "human capital": the creation of a material base in the process of formation and use of the family budget, housekeeping. 2.
Production of "human capital": childbearing, educational, recreational functions; at this stage, the physical basis of "human capital" is produced, which develops and adapts to the socio-economic system of life. For the production of "human capital" are necessary: the producers themselves, family members, material resources, goods and services. 3.
Implementation of "human capital": implementation of the function through various ways of entrepreneurship and employment, individual participation of family members in the market economy, organization of a family business, corporate forms of family participation in the market economy, housekeeping, income generation and distribution. Let us represent the structure of the function schematically (Fig. 3).
All functions have a targeted focus on the accumulation and reimbursement of costs associated with the creation of "human capital" and the development of entrepreneurial potential.
Rice. 3. Formation of human capital in the family
The traditional economic function of the Soviet family has undergone radical changes. The provision of education, medical, cultural and leisure services becomes paid and thus difficult for the family budget. An increasing number of families cannot pay utility bills. And the solution of the housing problem, the improvement of living conditions are completely dependent on the material condition of the family. Therefore, not only “legalized”, but also becomes the main accumulation of material values and their transmission by inheritance. And this is correct, since only property is a real guarantee of the social security of the family. Indeed, in the system of intra-family relations, economic ones take the place of the foundation, the basis in which all other relations materialize: emotional, moral, social, reproductive, etc.
The accumulation of wealth, the acquisition of property, movable and immovable property was not characteristic of the Soviet family and was applied only to "capitalism". This ideology obscured the real state of affairs. For example, in 1986, Soviet people owned about 760 billion rubles worth of household goods, which was equal to the value of the fixed assets of industry or the fixed assets of the entire non-productive sphere, including health care and education. Deposits in Sberbank amounted to 275 billion rubles, which was 30 billion rubles more than the expenditure part of the budget for the development of the entire national economy in 1987. But this was not private, but personal property, which could not be used to generate income, called at that time "unemployed".
In a market economy, the accumulation of property, the acquisition of property and the problems of its inheritance increase the role of the family in economic relations.
Due to the fact that in the period of transition to a market economy, the issues of differentiation of labor incomes have become of paramount importance, researchers most often determine the standard of living and the extent of poverty of the population, mainly by the status of the family. And this is in conditions when almost all social services (education, medicine, subsidies for the maintenance of housing and preschool institutions, recreation, etc.), previously received from the state from public consumption funds, are paid from the family budget. The reason is not only in the state budget deficit, but also in the change in the ideology of the relationship between the family and the state.
The main indicator in assessing poverty is per capita income, which makes it possible to assess the ability of a family to meet its current (everyday and periodic) needs. This is an indicator of the current poverty of families that are currently in a difficult financial situation.
The so-called “global poverty” of an individual or family that lacks such essential components of well-being as housing and property has deeper social consequences.
Therefore, not just the average per capita income should be used as a criterion of poverty, but a combination of the level of family income and their property security, i.e. the socio-economic potential of the family, determined by the level of income from all types of activities, the availability of property (including housing, property) , taking into account the socio-demographic characteristics of family members (age, professional level, health status, etc.).
It would be methodologically correct to consider poverty as a combination of low property security, poor housing conditions and low per capita income.
The budget of any family consists of its income and expenses. The source of data on the family budget is sample surveys of families for different social groups of the population (the method of state statistical observation of the standard of living of the population). Now 49,175 households are covered by such surveys on a quarterly basis.
The total income of a family is the sum of the annual income of its members, calculated in rubles and received in the form of entrepreneurial income, wages, scholarships, pensions, allowances, subsidies, the value of net products from a personal agricultural subsidiary or any other farm (according to the actual amount of sale). This includes income from free, preferential family consumption of material goods and services from public consumption funds, from winnings on loans and lotteries, as well as interest on deposits in banks, from shares, etc.
The family cross-section of the results of the survey conducted by the Institute of the Family in 1993-1994 makes it possible to differentiate the population by socio-economic potential as follows:
extremely poor (low income, poor living conditions, lack of real estate);
low-income, or relatively poor (low income, but there is real estate, average living conditions);
middle-income, but low-income (average income, no real estate, poor living conditions);
highly profitable (high income, but poor living conditions, no real estate);
rich (high income, real estate, living conditions above average).
Based on this study, four levels of material security of the family were identified:
families of the first level of poverty (poverty level), per capita income below or equal to the level of the minimum wage;
families of the second level of poverty (low-income families), whose per capita income is in the interval between the size of the minimum wage and the cost estimate of the subsistence minimum budget;
wealthy families whose total per capita income corresponds to the average per capita income in the region;
wealthy families whose total per capita income is higher than the average per capita income in the region.
A survey of families of various socio-demographic types made it possible, when studying their socio-economic potential, to establish that in the modern conditions of the transitional period, not only the traditionally “weak” (large, single-parent, families of the disabled) were below the poverty line, but also ordinary, normally functioning families.
These changes are far from the same in different regions of the country.
The degree of variation in the share of families with incomes below the poverty line ranges from 20 to 40% in the surveyed regions.
One of the factors of poverty is the high dependency burden, which predetermines the low level of per capita income. Therefore, the traditional object of state social support were large and single-parent families. At present, among the low-income, there is a high proportion of traditionally prosperous families, consisting of married couples with one or two children, where poverty is due to low wages or unemployment of one of the parents. The emergence of such categories of low-income families requires a reorientation of attention public services social protection, first of all, on the creation of conditions for the self-sufficiency of families, including stimulating the development of family business, home-based crafts, promoting the creation of small and medium-sized enterprises, effective jobs.
Unfortunately, since the early 1990s 20th century in mentality Russian families, the behavior of their members has not yet changed, adequate to the requirements of the market. Sociological surveys show that the majority of families associate the improvement of their economic situation with the help of the state, with the receipt of wages, transfers and various forms of support.
At the beginning of the XXI century. one of the directions of the social policy of the state has become a reorientation towards the adaptation of families of various types to the requirements of the market, stimulating the internal potential for economic activity and creating conditions for the implementation of the economic function of self-sufficiency.
In order for the state to understand its responsibility for observing the inalienable right of every family to a decent life, it took a lot of time for countries with developed market relations. This was facilitated both by the spread of socialist ideology and the political pressure of leftist parties, as well as by the objective need to improve the quality characteristics of the labor force.
The reality of the process is indicated by the experience of many industrialized countries, which have significantly raised the bar for people's well-being. Such a level of development for our country is a matter of long-term prospects. However, despite the economic difficulties of the transition period, the Russian state has largely retained the social orientation of its policy and, based on real possibilities, provides social assistance not only low-income families but especially families with children.
In order to activate the economic function of the family in territorial centers social assistance to families and children, in accordance with the Model Regulations, departments of socio-economic assistance are being created. The main activities of these departments are:
advising on issues of family self-sufficiency, development of family business, home-based crafts;
assistance in solving employment issues, placement in retraining courses;
social patronage of large, incomplete, low-income families, social support for graduates of orphanages and boarding schools at the initial stage of independent life until they reach adulthood and material independence;
organizing events to raise funds to help low-income families (exhibitions and sales of second-hand items, charity auctions, lotteries, etc.);
consulting on social and legal issues (housing, family, labor, civil, pension legislation, rights of children, women, disabled people);
assistance in obtaining benefits, allowances, compensations and other payments, material and in-kind assistance, loans, alimony, improvement of living conditions in accordance with applicable law.
The creation of such units will undoubtedly contribute to strengthening the protective function of the family in difficult market conditions.
In a stable society, periodic fluctuations in the life cycle of the family, its economic condition is a normal phenomenon. It depends on the demographic factor and the sequence of events in the life of a family that in one way or another change its status (the age of marriage, the birth of children, the beginning of their labor activity and earnings, advanced training, retirement, etc.).
In the period the country is going through, underestimation of the factor of cyclical development of families and the peculiarities of their socio-economic situation can lead to errors in determining the prospects for the development of society.
Analysis of the possibilities of the family in the implementation of its socio-economic functions is necessary for the state and sets before it three classes of tasks. 1.
Establishment of causal relationships between the demographic, social and economic life of the family. 2.
Determining the boundaries and directions of the depth of society's intervention in the processes of shaping the living standards of families, creating the necessary prerequisites for a more complete realization of the potential of families for self-sufficiency. First of all, this applies to able-bodied family members: qualifications, employment, social mobility, the opportunity and desire for entrepreneurial activity. 3.
Problems of predicting the standard of living of society.
A characteristic feature of the transition period is the contradiction
between growing needs for social support population and the narrowing of resource opportunities to meet them. For this reason, the dimensions social benefits should be coordinated, first of all, with the financial capabilities of the state. Totally unacceptable extension social spending beyond tax revenues and turning them into one of the factors of the budget deficit and inflation.
The amount of the allowance and the very fact of its payment should not create a situation in which receiving the allowance is preferable to receiving wages (income), and exceeding the optimal amount of deductions for social purposes should not provoke a decrease in the efficiency of social production.
Therefore, the question of choosing an objective criterion of low income, which could be guided by the provision of economic assistance to the family by the state and its social services, is becoming more and more acute.
Usually the criterion is the average per capita cash income of the family. If at the moment it is below the established minimum, the family is considered poor and legally applying for state assistance. However, practice shows that in a number of cases a family with low per capita money incomes has property at the level of an average family and even higher, and a family with high money incomes, on the contrary. This phenomenon is especially often observed among the so-called complex families (a young family living with their parents). Ownership of this kind of property, such as a car, a garage, a dacha, etc., makes a family fairly well-to-do even with low incomes. Therefore, such a family should not receive assistance from the state in the first place.
How can we realistically, fairly, objectively calculate the average per capita income of a family? How to take into account the specifics of the socio-economic component of the family and its changes? This requires science to further develop a mechanism for accounting, unification of indicators and their allocation to state statistics.
Realizing that property is the only real guarantee of the social security of the family, the state began to privatize property. Unfortunately, an attempt was made to implement this idea through universal voucherization, which did not bring real results. For universal privatization, like public property, is an economic nonsense.
As a result, now, as before, the bulk of the population lives only on wages, transfers, and income from personal subsidiary plots. Only a small part of the income the family receives from private entrepreneurship, from the securities market.
In the issue of social protection of the family by the state, usually the main focus is on improving the system state benefits family and children. There is a reason for this only from the point of view of the problem of improving the criteria for low-income ™, taking into account the socio-economic potential of families.
It seems more important to pay attention to the role of the state in creating conditions conducive to the development of family business and stimulating it. And this is exactly what contributes to the solution of the main issue of the present moment - the self-sufficiency of the family, the ability of its members to provide a decent lifestyle with their work.
With the development of market relations, the economic isolation of the family in society and its role as the primary economic unit in microeconomics are becoming increasingly stronger. The emphasis is shifting from consumption to entrepreneurship. The family becomes the subject of economic relations.
Under the conditions of the transition period, only a small part of the families realized this change in their economic function and actively joined in the process of creating an independent economic basis based on the use of legally permitted changes in property relations and forms of management.
This process develops most massively in the countryside. This applies not so much to the organization of farms, the number of which is relatively small, but to the total mass of rural workers who throughout the years of the existence of the Soviet system received most of their family income from personal subsidiary plots.
In cities, the bulk of families continue to hope that their participation in social production should be limited to the fact that adult members work in state enterprises or institutions and thus provide the family with a material basis for existence. Therefore, now, in the context of a decline in production and inflation, many families are at the poverty line.
More closely intertwined with economic and educational function- teaching family members, especially children, various crafts and family self-service: sewing, repairing clothes and shoes, household appliances, plumbing, etc. From early childhood, it is necessary to cultivate the ability to consume reasonably, to compare expenses with income, and the ability to competently manage the family budget.
The function of leisure is changing. In the past, leisure was synonymous with entertainment and recreation. Now, due to the difficulties of life, leisure should also have an economic content. Assistance to families in solving these problems should become one of the functions of centers for helping families and children.
In this regard, it becomes necessary to create on the ground a data bank on the real incomes of citizens and families potentially classified as in need of state social protection: single-parent and large families, as well as families with disabilities, lonely elderly, etc. In this case, one should take into account the declared income and cash receipts in the form of wages, pensions, scholarships, as well as the availability of property that can generate income or can be pledged when a family takes a loan from a bank: cottages, cars, apartments, etc. This requires the necessary adoption of a law on the mandatory declaration of income by all members of society, an increase in the role and responsibility of tax authorities and citizens for tax evasion.
The implementation of the strategic goal of family policy - strengthening families with children - suggests that in the changing socio-economic conditions, the activities of the state and other possible subjects of family policy should be coordinated within the overall economic strategy and based on the potentials expressed by the formula: income-taxes loans. This implies a reorientation from various types of payments, allowances and benefits to certain types of families most in need of protection, to mechanisms built into the market system for the formation, redistribution and use of income. In other words, family policy should be aimed at creating conditions in which families and their members could themselves and, moreover, more efficiently than before, extract income from their economic activities and use them to maintain an acceptable way of life for themselves.
Consequently, the main economic means of social protection of the family should be the implementation of the family, tax and credit policy of the state. The state is called upon to support and encourage any form of family economic activity (except for criminal activity), which strengthens the autonomy and independence of families as economic agents in the formation of state income and the wealth of society.
One cannot but agree with the opinion of A. I. Antonov and V. M. Medkov that the state, together with other subjects of social policy, should create conditions for the revival of the “single-income family”, a situation where the income of one adult family member provides the conditions for its normal life activities, including the birth and socialization of children.
The creation of these conditions will ensure the real economic and social independence of the family, its effective functioning both in its own interests and in the interests of the whole society, strengthening the socio-economic status of the family - an integral indicator that reflects in family relations the features of the socio-political structure of the state, its legal foundations, the level of development of the economy, culture and public consciousness.


