Financial situation and living conditions as factors influencing the mobility of the Russian population
Financial situation. The analysis of the respondents’ financial situation was based, first of all, on the respondents’ own assessment of their well-being. The assessment was given in five positions - from those living financially “very well” (2.5%), just “good” (19%), “average” (58.1%) to those experiencing financial difficulties (17.5%) and even “barely making ends meet” (1.8%) (Fig. 1). A small number of respondents found it difficult to classify themselves as belonging to any of these groups (1%).
Figure 1. Assessment of the family’s financial situation
Table 1 shows the distribution of respondents in each of these groups by gender, age and education.
Table 1. Gender, age and education of respondents with different financial status, %
|
Financial situation* |
Total |
Floor |
Age |
Education |
|||||||
|
Husband. |
Women |
18-19 |
20-24 |
25-29 |
30-39 |
40-49 |
Higher and present |
Average |
Below average |
||
|
We are provided with everything, we think that we live very well |
|||||||||||
|
We live well, without any special financial problems |
|||||||||||
|
We live an average life |
|||||||||||
|
We live hard financially, we have to save on everything |
|||||||||||
|
We live very poorly, we can barely make ends meet |
|||||||||||
|
Difficult to answer |
|||||||||||
|
Total |
|||||||||||
* In further tables and figures we do not give the full name of each group according to the questionnaire, but limit ourselves to the initial phrases: “we live very well”, “we live well”, “we live average”, “we live difficult”, “we live very poorly”.
As we can see, there are no big differences in the financial situation of men and women, although women were still slightly poorer. The connections between age and financial situation are closer: the older the respondents, the poorer they are (the share of the oldest age group among those living well is almost two times lower than the youngest - 14% and 27%; among the poor, the difference between them is even more significant - 2 .5 times – 24% and 9%, respectively.
The financial situation turned out to be directly related to the level of education of the respondents: the higher it is, the better the respondents live.
The data obtained were also compared with the results of an all-Russian survey by the Yuri Levada Analytical Center, conducted in September 2005. The gender, age and educational patterns we identified were fully confirmed by the data of the all-Russian survey (Table 2), and the difference in the figures is most likely explained by the characteristics of the sample: we surveyed only the population of regional centers, and limited ourselves to people under 50 years of age, while the all-Russian survey covered the entire population and all ages. Apparently, in regional centers the standard of living is significantly higher than the national average (21% living well versus 11% in the country as a whole; 20% living poorly versus 33% in Russia).
Table 2. Financial situation according to the results of two surveys(data from the all-Russian survey by Levada Center are given in parentheses)
|
Financial situation |
Total |
Floor |
Age |
Education |
||||
|
Husband. |
Women |
Up to 29 years old |
30-49 |
Higher and present |
Average |
Below average |
||
|
We live well* |
21 (11) |
24 (11) |
19 (10) |
26 (20) |
18 (10) |
28 (16) |
18 (10) |
16 (9) |
|
We live an average life |
58 (55) |
57 (57) |
59 (53) |
59 (60) |
57 (57) |
56 (59) |
60 (57) |
55 (49) |
|
We live hard* |
20 (33) |
17 (30) |
21 (36) |
14 (19) |
23 (32) |
15 (24) |
21 (32) |
27 (41) |
In our study, to verify the expressed subjective assessments of the financial situation, we used the answers of respondents from each of the identified five groups to specific questions regarding material wealth (purchasing food without restrictions, owning a car, computer, washing machine etc.). The actual data largely confirmed the subjective assessments made: the percentage of those possessing various material benefits decreases significantly from the first two financially prosperous groups to the middle and then to the two groups having financial difficulties. And, conversely, The higher respondents rate their material well-being, the lower the percentage of them who talk about any deprivation. At the same time, the differences between the rich and the poor are very sharp - the shares of those who have certain material benefits differ significantly! For example, among those living well, compared to those living difficultly, the proportion of those who buy as much meat and sausage as they want is eight times higher (90% and 11%, respectively).
The poor and even the average living cannot afford to go on holiday (to middle group about 40% did not go on vacation due to lack of funds, and in the two poor groups this figure ranged from 60 to 80%).
There is a significant difference between rich and poor in receiving medical care. Logically, all Russian citizens should have access to free medicine under the compulsory health insurance policy. However, the percentage of people using it is reduced in two groups – the subjectively richest and the poorest (up to 76%; with 85% on average). Equality in in this case imaginary, because among the most financially prosperous, 27% receive the missing medical care, using the services of private medicine, while among the poorest there are three times less of them - only 9%. In addition, 6% of the financially prosperous use insurance paid for by the enterprise, while among the poor there are no such people at all. Apparently, this state of affairs further aggravates the depth of poverty of the latter group.
In general, it can be noted that for a significant portion of the poor, the modern lifestyle is inaccessible - almost 40% of them are deprived of any material goods at all (i.e., they have no mobile phones, no washing machines, no computers, no microwave ovens , no cars, no dachas, not even just land plots for vegetable gardens).
Additional confirmation of the existence of five groups that differ in material well-being is the clearly visible difference from group to group in the share of family income that is spent on food - the corresponding question was asked to respondents (Fig. 2).
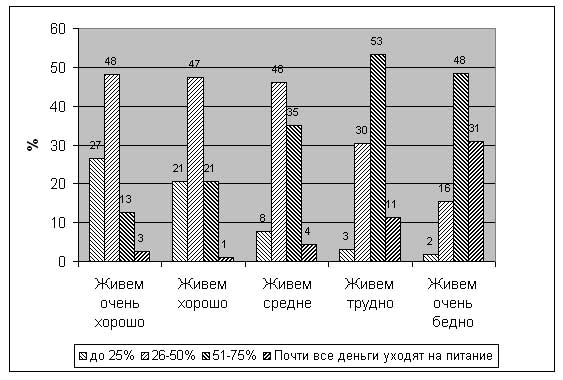
Figure 2. Percentage of family income spent on food per month, depending on the level of material well-being
These studies clearly confirm the well-known postulate that As wealth increases, the share of food costs in the family budget decreases.
Regional characteristics of the financial situation of respondents are reflected in Table 3 and Fig. 3. It should be taken into account that in each of the cities where the survey was conducted, the number of respondents was 10 times less than the entire array, therefore, when moving to the regional level, it is advisable to reduce the number of property groups: those who live well - respondents of the first two groups; average living; those living difficultly are respondents from the last two groups.
Table 3. How would you assess the financial situation of your family?,%
|
Financial situation |
Total |
Saint Petersburg |
Novo-Sibirsk |
Nizhny Novgorod |
Kazan |
Kras-nodar |
Vladi-East |
Oren-burg |
Belgorod |
Smo-lensk |
Nal-chik |
|
We live well |
21,5 |
20,9 |
25,2 |
22,2 |
27,2 |
32,8 |
21,9 |
21,4 |
10,3 |
16,9 |
15,9 |
|
We live an average life |
58,1 |
58,4 |
58,9 |
61,2 |
56,6 |
50,9 |
60,9 |
61,9 |
53,7 |
65,3 |
53,1 |
|
We live hard |
19,3 |
20,3 |
15,5 |
15,3 |
13,1 |
15,6 |
16,3 |
15,8 |
35,6 |
16,0 |
30,0 |
|
Welfare Index* |
*ratio of the share of the wealthy (group 1) to the share of those experiencing financial difficulties (group 3)

Figure 3. Family financial situation, %
According to the welfare index, Kazan and Krasnodar were the most prosperous (the share of the rich is more than twice as high as the share of the poor), and the worst places were Nalchik (there are twice as many poor as the rich) and, especially, Belgorod (the share of the poor is more than three times exceeds the share of the rich). In another four cities the welfare index is above average - Novosibirsk, Nizhny Novgorod, Orenburg and Vladivostok (the share of the rich is 1.6-1.3 times higher than the share of the poor), and in two cities - St. Petersburg and Smolensk - the welfare index is at an average level , and the shares of rich and poor are approximately equal.
This property distribution across cities is mainly confirmed by data on the presence or absence of material wealth, as well as the share of family budget expenditures on food.
For two cities - Kazan and Nalchik - it was also possible to identify differences in the financial situation of respondents of different nationalities (the question about national self-identification was included in the questionnaire) (Fig. 4).

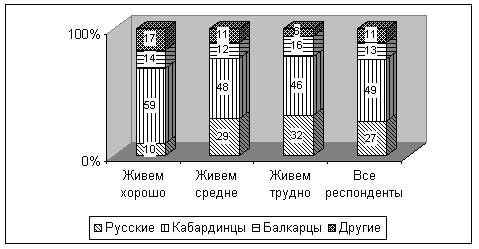
2. Nalchik
Figure 4. Family financial situation and nationality of respondents, %
In Kazan, with almost the same proportion of Russians and Tatars in the sample as a whole, the group of poor people is 60% formed by Russians, while there are 2 times fewer Tatars in it - 30%. And, conversely, in the wealthy group there are 46% Russians and 52% Tatars. The fact that the gap in this group is not very significant suggests that national discrimination in the formation of the material elite is not so high. And the fact that there are many Russians among the poor rather speaks of different mentalities, including different attitudes towards work and alcohol.
The national distribution of poor and rich in Nalchik tells a little different story. Here the main differences are revealed precisely in the rich group: Russians in the entire sample are 1.8 times smaller than Kabardians, and among the rich – 6 times (!); the share of Balkars in the sample is 2 times lower than Russians, and among the rich it is 1.4 times higher. This ratio clearly indicates the presence of national discrimination in the division of areas that bring the main material income.
Final characteristics of groups of respondents with different financial status
Let us briefly formulate the characteristics of each of the 5 groups with different material incomes.
1. “We are provided with everything, we think that we live very well” (2.5% of respondents, 79 people). The wealthiest are the youngest (average age 29 years; 60% of respondents are under 30 years old) and the most educated - half have higher or incomplete higher education (the average for the entire population is 35%). The predominance of men is noticeable in comparison with the average for the population (in the group there are 57% men and 43% women, and the average figures for the array are 47% and 53%, respectively). In terms of marital status and number of children, the group does not differ much from the average. The most common household size is 3 people (41% of respondents). Among respondents in this group, the proportion of those who do not have any migration history and were born in the city where the survey was conducted is slightly reduced (54% versus 58% on average).
The vast majority of them have a modern way of life. Families have a car (63%), a computer (57%), a washing machine (75%), a microwave oven (67%), and a mobile phone (87%). A fifth of them go on vacation abroad (the average is 3%), more than a quarter pay for medical services themselves. These people almost never experience difficulties when buying food and spend less than half of the family budget on food (75% of respondents).
More than half of those representing the wealthiest group have a per capita income above 6,000 rubles. They are less likely to work in a state-owned enterprise (25% of those employed, compared to 42% on average for the entire population), but are noticeably more likely to have their own business (23% of those employed, compared to 7% on average).
2. “We live well, without any special material problems” (19% of respondents; 613 people). Representatives of this group are also relatively young, although not as much as in the first (average age 31 years, 49% are under 30 years old), and well educated (46% have higher or incomplete higher education). Men also predominate among them, although with a smaller margin (53% of men and 47% of women). Marital status, number of children, number of household members are close to average. But according to their migration history, this group is more settled - 62% of respondents have never changed their place of residence.
Representatives of this group also have basic material benefits, although compared to the wealthiest, the level of saturation with them is slightly reduced: 57% have a car in the family, 56% have a computer, 77% have automatic washing machine, 58% - microwave oven, 85% - mobile phone. They are less likely than the wealthiest to go on vacation in Russia and abroad (15% and 7%), but these figures are also much higher than average (7% and 2%). A quarter of them can afford to pay for medical services themselves.
In terms of food consumption, this group is not much different from the first - 90% buy as much meat as they want, and in general, 68% of them spend less than half of the family budget on food. However, in this group there is already a fairly large proportion of those who “eat up” from half to three-quarters of the budget - 21%.
Per capita income is noticeably lower - 61% limited it to between 3,000 and 10,000 rubles. Compared to the wealthiest respondents in this group, they are almost half as likely to have their own business (12% versus 23%), but almost twice as likely to use the help of relatives and friends (10% versus 5%).
3. “We live an average life” (58.1% of respondents, 1871 people). The largest group, which fully justifies its name, because its characteristics almost always correspond to the average for the entire array. Middle age respondents 33 years old; 42% are under 30 years old, 26% are from 30 to 40 years old, 31% are from 40 to 49 years old. 34% of respondents had higher or incomplete higher education; There are also large numbers of people with specialized secondary and complete secondary education (28% each). The ratio of men to women is close to average (46% men and 53% women). Most households consist of three people (34%), but those with four people (28%) are close in number. Marital status and number of children are at an average level (33% single and 54% married; 37% with one child and 14% with two). This group is also average in terms of the number of people who moved – 58% were born and never left their city.
In this group, the proportion of those whose everyday life is filled with modern objects is already noticeably lower. Only a third have a car in the family (and more than 20% are used), 33% have a computer, 58% have an automatic washing machine, 36% have a microwave oven, 74% have a mobile phone. They almost never go on vacation abroad and travel less often around Russia (2% and 7%, respectively). Only 18% of them can afford to pay for medical services on their own.
Only half of those “living average” do not deny themselves the purchase of meat products, and in general, the majority spends from a quarter to three-quarters of the family budget on food – 81%.
The income of the majority of representatives of the middle group (74%) ranges from 1,000 to 6,000 rubles. The majority live on income from wages at their main place of work, but compared to wealthy groups, the share of those receiving various pensions increases significantly (18%).
4. “It’s difficult to live financially, we have to save on everything” (17.5% of respondents, 565 people). In this group, most property indicators are significantly lower and lag behind the average level as much as it is exceeded in the first two wealthy groups. The respondents in this group are older - the average age is 36 years (less than 30% are under 30 years old, but 42% are over 40 years old). Less than a third have higher or incomplete higher education, 30% have specialized secondary education, 28% have complete secondary education, and already 14% have incomplete secondary education (in the previous group there were less than 10% of these, and among the wealthy - only 5%). The share of women is growing noticeably – 59% versus 41% of men. Among the characteristics of the group is a smaller proportion of single people - 26% (with an average of 33%), but an increased proportion of widowed and divorced people (5% and 14%, respectively). Thus, the family situation of a significant number of respondents is clearly less favorable than in the previous three groups. Respondents in this group are record holders for the share of families with children - only 41% do not have children under 18 years of age (versus 50-54% in wealthy groups). The majority of families with one child (41%), but at the same time the share large families(three or more children) exceeds the average by more than twice (5% with an average of 2%). These figures once again confirm the conclusion made by researchers of poverty in Russia, who conclude that “the largest group of the poor population is families with children; ...they make up 50-60% of the total number of poor families.”
Representatives of this group have the richest migration history - only 51% of them have never moved anywhere (with an average of 58%).
The percentage of those who own modern household items among the group's respondents is sharply reduced: only a fifth own a car (more than half of them used), 19% own a computer, 38% own a washing machine, 17% own a microwave oven, 52% own mobile phone. They rarely go on vacation both in Russia and abroad (3% and 2%, respectively). But at the same time, 16% are forced to pay for medical services themselves. The situation with food purchases is even worse: only 11% buy enough meat and meat products; 84% spend from a quarter to three quarters of their family budget on food, and 11% spend all their money on food.
In terms of income, 81% fall into the gradation from 1000 to 6000 rubles, with the vast majority (56%) falling into its lower limit - from 1000 to 3000 rubles. A tenth generally lives on less than 1,000 rubles a month. Among sources of income, the role of pensions (29% with an average of 18%) and benefits (14% with an average of 10%) is increasing.
5. “We live very poorly, we can barely make ends meet” (2% of respondents; 58 people). The poorest and smallest group.
The average age is 35 years, and all age intervals (up to 30, up to 40, up to 50 years) are represented almost equally (33-34%). The respondents are the least educated - only 19% have higher or incomplete higher education and the same number do not have complete secondary education. Interestingly, the ratio of men and women completely follows the structure of the wealthiest group - 57% men and 43% women. The most common household size, as in other groups, is 3 people (26% of respondents), but at the same time the proportion of people living in twos (22.4% with an average of 17.5%) and alone (17% with an average 8%). The marital status of respondents also differs from the average - only 34% are married (with 53% on average), the maximum proportion of divorced people is 19% (with 8% on average) and an increased share of widows is 3.5% (with 2% on average). Thus, as in the previous group, the family situation is not very favorable. Exactly half of the families do not have children under 18 years of age, and a feature of the second half is the increased proportion of large families (8% against 2% of the entire population).
The poorest are the most settled - 66% have never moved anywhere in their lives.
The household items we have listed are even less common than in the previous group: 22% own a car (12% a used one), 16% own a computer, 19% own a washing machine, 14% own a microwave oven, 35% own a mobile phone. No one went abroad on vacation, and in Russia only 3%. Medical services are paid for independently by 9%.
Half of the representatives of this group very rarely allow themselves to buy meat and sausage, because... There is not enough money for this (in the average group there are only 3%). In general, 79% spend more than half of the family budget on food, and a third of respondents spend all their money on food.
Two-thirds of respondents in this group live on incomes of less than 3,000 rubles per month per person (while a third live on less than 1,000 rubles). About a third of the poorest households do not have a source of income such as their main paid job, and among the respondents themselves, half do not work at all (with an average of 30%). At the same time, those living on income from pensions are much more common - 29% (average - 18%), benefits - 19% (10%) and receiving financial assistance from relatives and friends – 19% (10%). Those who work themselves are much more likely than representatives of other groups to work under a verbal agreement and receive wages completely unofficially (32% with an average of 9%).
Thus, the subjective distribution of respondents into five different groups of material security received fairly solid factual confirmation when analyzing all property, and partly, gender, age, educational, labor and other indicators. The confirmed representativeness of the data will allow us in the future, when characterizing the migration mobility of the population, to rely specifically on these property groups.
Financial situation and mobility . Let's see if there is a difference in migration intentions among respondents with different material incomes (Table 4).
Table 4. Financial situation and migration intentions, %
|
Yes, I have definitely decided to move and am taking active steps |
I'm planning to move, but I'm not doing anything yet |
Sometimes I think about moving |
I would like to leave for a while (no more than a year) |
I don’t want and don’t intend to move |
Didn't think about it |
|
|
We live well* |
62,9 |
27,2 |
||||
|
We live an average life |
61,2 |
27,4 |
||||
|
We live hard* |
60,4 |
24,7 |
||||
|
All |
61,3 |
27,0 |
*The table combines the first two positions (“we live very well” and “we live well”) and the last two positions (“we live difficult” and “we live very poorly”).
As you can see, the difference between the groups is very small, although the overwhelming majority of representatives of either group are not inclined to move. Wealthy people are more active in real actions, but less active in intentions. A group of people living in difficulty are largely considering the possibility of moving, but so far only in theory. In addition, the share of those wishing to work temporarily is twice as high (wealthy people need this to a much lesser extent).
A comparison of migration mobility (both real and potential) of poor and rich residents of 10 regional centers demonstrates a greater diversity of positions. And although in most cities the mood and not the mood to move is also characteristic of all groups of the population approximately equally, regardless of financial situation, there are still exceptions. Thus, two obvious “migration” leaders among cities – Nalchik and Vladivostok – differ quite significantly in the approaches of rich and poor to migration. If in Nalchik the share of the poor who have migration intentions is slightly higher than the share of the rich who are planning to move - only 6%, then in Vladivostok this difference is almost two times (31 and 16%, respectively). And in Smolensk, which ranks third in terms of migration sentiment among the population, on the contrary, the rich are much more active (22% versus 10%). One can also note the complete absence of migration activity among wealthy residents of Nizhny Novgorod and Belgorod (0%) and the extremely low level of mobility among poor residents of Kazan (2%).
In general, the hierarchy of regional centers for migration mobility is not so directly related to their classification according to the welfare index. For example, two “poor” cities – Nalchik and Belgorod – demonstrate a radically different attitude towards migration (24 and 6% of those with migration intentions, respectively); Smolensk and St. Petersburg, which are similar in terms of the welfare index, differ more than twice in the level of migration mobility (15 and 7%, respectively); Vladivostok, which is approximately equal to Nizhny Novgorod in terms of the level of well-being of its residents, is more than 5 times higher in terms of the population’s disposition to migrate (22% versus 4%). To a greater extent, migration mobility turned out to be associated with respondents’ integral assessment of their cities, expressed in the proportion of those satisfied with life in them (Fig. 5).
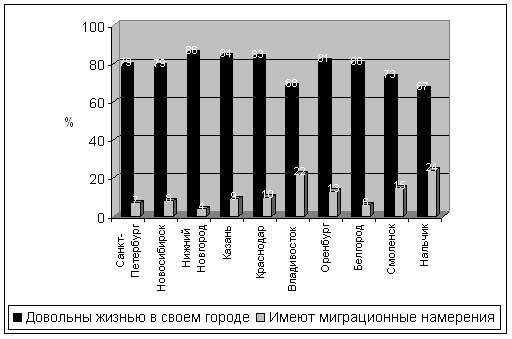
Figure 5. Satisfied with life in their city and having migration intentions, %
At least for leaders and outsiders, the correlation is the opposite, and very close: where the shares of those satisfied with life are the lowest (Nalchik, Vladivostok, Smolensk), there the mood for migration is highest; and, conversely, in Nizhny Novgorod most satisfied with life (86%) and least likely to move.
If, in general, the migration intentions of the poor and the rich across the entire massif differ slightly, then the differences in the reasons for the emergence of plans to move are more significant. Among the wealthy, they are largely related to family circumstances: 22% are going to move to relatives, 33% are going to move for “other reasons” not related to work, housing, education, and only 32% - because there is no good work, 7% - due to poor housing. At the same time, among those living in difficult circumstances, 50% cited lack of work as the reasons for leaving, 25% cited poor housing, and only 16% cited family reasons, and 15% cited “other reasons.”
A comparison of responses to a hypothetical offer of work and housing in another city also shows the difference between the approaches of unemployed respondents living in wealthy and poor families: 23% of wealthy people would move, and 54% of them answered “no” or “probably not”; among the poor, the ratio is slightly different – 27% and 40%, respectively. And in the middle-income group, there were generally equal numbers of respondents who answered “yes” and “no” - 34% each.
Low migration mobility can also be seen in the answers about the future education of children: 60% would like their children to study in their city (let me remind you that 61% do not intend to move themselves). At the same time, the wealthy want to keep their children with them even more – 64%. Only 4% are ready to send their children to study in another city in Russia and 5% abroad. The poor are ahead here - among them 7% allow the option of studying abroad. At the same time, the wealthy are more likely to insist on their decision - only 16% left the right of choice to their children (on average - 23%). Thus, it is unlikely that children's educational mobility will be high.
The picture is similar in parents’ choice of their children’s future place of residence: 62% preferred that their children live in their city or nearby (among those who answered specifically “in our city,” the percentage of those who are wealthy is slightly higher – 48% versus 42% of those living in poverty.
In their approach to the education of children and the choice of their place of residence, Nalchik respondents stand somewhat apart. When asked to spend a hypothetical winnings of 600 thousand rubles, 22% of Nalchik residents responded that they would use it to educate their children (with an average of 14% for all cities). The share of those who answered in this way was especially high among poor respondents in Nalchik - 30% versus 17% on average for the sample. At the same time, residents of Nalchik count on their city as a future place for their children to receive education much less than others - only 20% of the wealthy, 36% of those living in the middle class and 45% of the poor would like their children to study in their city (the average for cities is 64%, 59% and 60%, respectively).
The agreement or disagreement expressed by respondents with the statements proposed to them regarding migration showed a clear predominance of, if not negative, then at least wary attitude, both towards the migration process itself and towards those who move a lot (Table 5).
Table 5. Views on migration and migrants, depending on wealth, in %
|
Statements |
We live well |
We live an average life |
We live hard |
All |
||||
|
Agree |
I don't agree-sen |
Agree |
I don't agree-sen |
Agree |
I don't agree-sen |
Agree |
I don't agree-sen |
|
|
You need to live where you were born and raised, where your family and friends live. |
||||||||
|
It’s the same everywhere, so there’s no need to look for the best |
||||||||
|
Those who move a lot from place to place are people without roots, they cannot get along anywhere |
||||||||
|
Moving people bring “turmoil” to society; there should be as few of them as possible |
||||||||
|
The most active and those who seek to improve their situation move |
||||||||
|
We need to move more, look for a better place to live. |
||||||||
|
I don’t care where to live, the main thing is that there is good job and normal living conditions |
||||||||
As we can see, there are almost no significant differences in the answers of respondents with different levels of wealth, and this means that a consensus has developed in society regarding migration. But it is still worth noting that the poor are a little more conservative in their views and are less inclined to change something in their lives.
The poor and the rich treat visitors almost equally. The only difference is that the poor more often express a negative attitude towards them (12% versus 6% of the rich). It is quite possible that this is caused by competition for jobs, which, if it exists, is only for those occupied by the least affluent segments of the population.
The same reaction from both the poor and the rich was caused by the question: “Are those who change their place of residence from time to time living better or worse than the rest of the population?” More than 60% answered “who knows”, i.e. They saw no real gain or loss in the situation of the migrants around them.
Let's sum it up. Despite the general similarity of views of all respondents on migration, the financial situation still leaves its mark. In general, less affluent respondents turned out to be more conservative in their views; they are less likely to consider migration a way to improve their lives (40% of them believe that “it’s the same everywhere”, and 63% - that “you need to live where was born”; among the wealthy, 32% and 54%, respectively, think so). This position of the poor is confirmed by other questions in the survey, in particular, the choice of reasons for their reluctance to look for work outside their city: the reason “I don’t believe that it will be better somewhere” was chosen by 27% of the unemployed poor and only 11% of the unemployed but living in wealthy families.
So, the main conclusion that can be drawn after studying the connections between financial status and migration mobility is as follows: With a very low level of migration mobility of the population as a whole, the difference between people of different material incomes in approaches to migration is not too great, but still exists. Those who are actually preparing to move are mostly the wealthy, while those who are experiencing financial difficulties are more likely to think about migration. But, given the fact that the wealthy are more likely to move for personal reasons not related to work, housing, etc., developers Policies promoting the growth of migration mobility of the labor force should be more oriented towards the less affluent segments of the population who are thinking about migration, but due to their conservatism and poverty are not ready to make a decision. We need to influence their views, convince them that “to look for the best O it”, create a positive image of the migrant as an active, purposeful person achieving his goals, and in addition, help with loans. This group, more than others, is interested in material incentives - good earnings (60% of the poor would like to move based on them), housing (30% of the poor looked for work only in their city, because there is nowhere to live in other places) , lifting (14% did not look for work in other places, because there is no money to move).
Housing conditions . Self-assessments of the respondents’ material well-being are quite consistent with the difference in their living conditions (Table 6).
Table 6. Financial situation and occupied housing, %
|
Financial situation |
Own separate apartment or house (part of a house) |
Non-private. department. Apartment |
Room(s) in the commune. quart.* |
We live in our parents' apartment |
In a hostel or office. housing |
With relatives, friends |
We rent housing |
Total |
|
We live very well |
87,4 |
|||||||
|
We live well |
70,8 |
13,4 |
||||||
|
We live an average life |
61,1 |
14,7 |
||||||
|
We live hard |
56,3 |
13,5 |
14,2 |
|||||
|
We live very poorly |
55,2 |
15,5 |
||||||
|
All respondents |
62,7 |
13,9 |
*There are approximately equal numbers of privatized and non-privatized
The main dividing line is the attitude of respondents towards the ownership of occupied housing: among the “richest”, almost 90% are owners of their home, and among the “poorest” only 55% are owners. At the same time, material security is also reflected in whether the housing is separate or not, but here the differences are significantly reduced, because low-income people often live in separate, but not privatized apartments (almost 16%, versus 1% in the richest group). Other features of the low-income group include the largest proportion of people living in a hostel (although this is small in itself - 5%) and relatives and friends using living space (7%). Renting housing turned out to be practically unrelated to the income of respondents (the share of renters in each group is approximately the same - 6-7%; we did not take into account the quality of rented housing), but at the same time, a close dependence of the share of renters on the time of arrival in a given locality was revealed - among those Those who arrived in the last 5 years use rented housing twice as many respondents – 10-13%.
For a quarter of respondents in the wealthiest group, the home they live in is not the only property they own. In the second and third groups there are 15 and 9%, respectively, and in the two subjectively poor – 6-7%.
People standing on different steps of the “material” ladder have different housing not only in type, but also in quality. This is evidenced by such indicators as the number square meters per person and the degree of satisfaction with their living conditions.
According to the 2002 census, the average total area per Russian citizen was 19 square meters. meters. In our study, the average is much lower – 15.7 square meters. meters, which is apparently explained by the absence of pensioners and rural residents in the sample, whose housing area is usually larger.
The number of square meters per person varies from 13 for the poorest to 20 for the richest. The degree of satisfaction with their housing changes even more sharply: from 17% satisfied in the low-income group to 82% in the maximum income group. The percentage of dissatisfied people changes in the opposite order: from 57% in the low-income group to 2.5% among the financially secure.
Brief description The living conditions of respondents in each of the groups, differing in financial status, are as follows:
“We are provided with everything” - almost 90% are owners of their own housing, and high-quality housing - a separate apartment or house (part of a house), where on average there is more than 20 square meters per person. meters. Naturally, such living conditions make the respondents themselves satisfied - 82% of them are satisfied with their housing, and for a quarter of the respondents in this group it is not the only one.
“We live well” - 71% own a separate apartment or house (part of a house). Compared to the first group, there are more owners of non-privatized individual apartments (5% versus 1%) and those living with their parents (13% versus 4%). On average, there are already 18 square meters per person. meters of total area, and the percentage of those completely satisfied with the quality of their housing is decreasing (to 62%). Real estate is not the only option for 15% of respondents.
“We live an average life” - 61% live in separate privatized housing and 10% in separate non-privatized housing. Almost 15% live with their parents. There are 15.2 square meters per person. meters of total area, and only 41% are satisfied with the quality of their housing. 9% of respondents own additional real estate in the city.
“We live hard” - 56% have their own separate housing, another 13.5% live in separate non-privatized housing, and 14% live with their parents. There are 14.4 square meters per person. meters of total area, and the share of those satisfied with the quality of housing does not reach even a quarter of the number of respondents in this group. Only 6% own additional real estate.
“We live very poorly” - 55% have their own separate housing, another 16% live in separate non-privatized housing. Few people live with their parents (only 5%), but the share of those living in a hostel has increased (5% with an average of 1.7%) and with relatives or friends (7% with an average of 1.5%). There are only 13 square meters per person. meters of total area (the smallest value among all groups), and the share of those satisfied with the quality of housing is also the smallest - 17%. 7% of respondents own additional real estate.
Housing conditions differ not only among groups of respondents with different financial status, but also vary quite significantly across the cities in which the survey was conducted (Table 7).
Table 7. Housing conditions by city survey
|
Total |
Saint Petersburg |
Novo-Sibirsk |
Nizhny Novgorod |
Kazan |
Kras-nodar |
Vladi-East |
Oren-burg |
Bel-gorod |
Smo-lensk |
Nal-chik |
|
|
Home ownership percentage |
|||||||||||
|
Percentage of people renting |
|||||||||||
|
Percentage satisfied with housing |
|||||||||||
|
Number of square meters per capita |
15,7 |
16,6 |
13,7 |
14,6 |
15,4 |
18,5 |
14,0 |
16,9 |
15,2 |
14,5 |
18,4 |
In terms of the share of owners, four cities are clearly in the lead - Nalchik, Orenburg, Krasnodar and Kazan, and four cities are noticeably behind - St. Petersburg, Novosibirsk, Nizhny Novgorod and Belgorod. In terms of the size of the total area per person, the picture is already somewhat different: Nalchik, Krasnodar and Orenburg remain in the leaders, and St. Petersburg takes the place of Kazan (16.6 square meters with 15.7 on average). Novosibirsk, Nizhny Novgorod and Belgorod lag behind in this indicator too (the minimum provision in Novosibirsk is 13.7 sq. meters); In addition, the size of housing per person is close to the minimum in Vladivostok and Smolensk. The share of rented housing varies little across cities, with the exception of two extremes - Kazan, where only 3% of people rent compared to 7% on average, and Vladivostok, where, on the contrary, 13% of respondents use rented housing. The most interesting thing is that the degree of satisfaction with housing in cities is not directly related to actual living conditions. Thus, the above fully explains the low percentage of those satisfied with their housing in Novosibirsk and Vladivostok (35% each, with an average of 43%) and the high percentage in Orenburg (54%). But at the same time, the highest share of satisfied people - 58% - is in the not very prosperous Kazan, and a rather low level of satisfaction - 38% - in the most prosperous Nalchik. Apparently, this indicator is largely connected with overestimated or underestimated living standards in a particular city.
Housing conditions and mobility . To analyze the impact of housing conditions on the migration mobility of the population, we first turn to the real experience of migrants, recorded in the answers to the questionnaire. First of all, it shows how the value changes housing issue for migrants at every stage of their journey. Only 3% thought about the housing problem and named it among the reasons for deciding to move to this city; already 7%, when choosing their current place of residence, expected to solve housing as one of the three main problems; and finally, 22% named it one of the three main difficulties in a new place. Thus, there is an underestimation by migrants of the importance of this problem at the decision-making stage.
Let's see how the housing problem was ultimately solved after moving to the surveyed cities (Table 8).
Table 8. Types of housing for the moving and settled population
|
Own separate apartment or house (part of a house) |
Non-private. department. apartment |
In the apartment of the husband's/wife's parents |
In the hostel |
Service housing |
We rent housing |
With relatives, friends |
|
|
Those who moved to the old place |
50,6 |
19,7 |
12,7 |
||||
|
Those moving to a new place |
59,9 |
12,1 |
|||||
|
Never moved |
64,8 |
16,9 |
|||||
|
Whole population |
62,7 |
13,9 |
As we can see, the bulk of those who moved were able to improve their living conditions, although migrants are still in a slightly worse situation compared to the local population that did not move (the gap approximately corresponds to the difference in the financial situation of those who moved and those who did not move). Noteworthy is the large percentage of migrants who rent housing, but these are mainly those who moved in recent years (80% after 1998) and have not yet managed to acquire real estate. In general, we can talk about the positive role of moving in terms of solving the housing problem.
The type of property a family currently occupies significantly influences its migration activity. Most people are satisfied only with their own housing, and those living in other conditions are more likely to move. 27% of those living in service housing had some kind of migration intentions (with an average for the array of 11%), 20% of those renting housing, 19% of those living with relatives and 15% of those living with their parents. In total, these categories of respondents represent about a quarter of residents of regional centers aged 18-50 years.
The push function of housing of poor quality and insufficient size does not manifest itself at the level of considering average indicators (62% of those living in such housing do not intend to move, compared with 61% on average). There are very few differences in the migration intentions of those who are generally satisfied and dissatisfied with their living conditions: respectively, 10 and 13% of them are more or less inclined to move. This is probably because the housing factor affects mobility in combination with other factors, and the same balance can develop with different combinations of their influence. On the other hand, when the intention to move already arises (quite possibly for a completely different reason, and not because of housing), then the role of housing appears very clearly. Among the three main reasons for the decision to leave, poor housing and the inability to improve it were named by 15% of respondents, and 21% said that what attracted them most to the new place was the opportunity to improve living conditions.
Respondents' underestimation of the role of housing in determining the reasons for making a decision to move is also evidenced by the high proportion of those who would expect to spend a hypothetical gain of 600 thousand rubles on housing. From 30 to 40%, depending on the city, would spend their winnings specifically on solving the housing problem, and in some cities the rich are going to do this to an even greater extent than the poor (for example, in St. Petersburg and Nizhny Novgorod). In fact, the housing problem has been solved only among the wealthy residents of Nalchik (only 12% would spend the winnings on housing). The table demonstrates the true role of housing in the lives of residents of Russian regional centers, but the majority understands that simply moving cannot solve the problem, so most often people go to earn money and then use it to improve their housing.
Indirect confirmation of this conclusion is the identified connection between migration intentions and intentions to improve housing. Among those who firmly plan to improve their living conditions in the near future, the share of those who actually intend to move is twice as high (2.6% versus 1.3% of those who do not plan to improve their housing) and there are noticeably fewer of those who are not at all inclined to moving (57% vs. 65%). In general, a fifth of those planning to improve their housing conditions do not exclude the possibility of doing this in another city (among those not planning to improve their housing conditions, only 8%) .
Main conclusion: poor living conditions and dissatisfaction with housing themselves do not serve as the main pushing factor, but are taken into account by people (sometimes even implicitly) when making a decision to move, and at each subsequent stage of preparation for migration to an increasing extent. It follows from this that policies that stimulate migration activity must necessarily appeal to people’s desire to improve their housing, demonstrating to them the positive experience of other migrants in solving this problem. Perhaps information about any housing benefits at a new place of residence (where the state wants to direct migration flows) should be disseminated, including through real estate companies, because it is where people who plan to improve their housing turn, and among them there is a considerable proportion of those who do not associate this improvement exclusively with their current city.
The study “Problems of territorial mobility in Russia” was conducted under the leadership of Zh.A. Zayonchkovskaya within the framework of the project of the Ministry of Economic Development of Russia and the Center for Migration Research. For the study, a sample of a total of 3200 respondents was designed, representing the population of regional centers of 10 regions of the Russian Federation aged from 18 to 49 (full) years.
Bulletin of public opinion. No. 6 (80). November – December 2005
Ovcharova L. Profile of Russian poverty / Population and society. No. 89. May 2005.
According to NOBUS, 26.0% of households in Russia are classified as poor, with a significant part of them concentrated at the poverty line and only for a tenth of them does poverty mean practically no means of subsistence [Ovcharova L. Profile of Russian poverty / Population and society. No. 89. May 2005]. This actually matches the results this study, where the share of the poor is 20%, of which 2% “barely make ends meet.”
“Assessing the achievement of planned results” - Assessment is an ongoing process, naturally integrated into educational practice. Sample correct answer: 2) pit, wind, number, yogurt. The main results of primary general education, formulated in the Standard Requirements. READING. The role and functions of the new system for assessing the achievement of planned results.
“Financial liability of the parties to an employment contract” - B judicial procedure. Types of financial liability. Within 1 year from the date of discovery of the damage caused. Financial liability is an independent type of legal liability. If the amount of recovery does not exceed the average earnings for 1 month. Grounds for holding parties to an employment contract financially liable.
“School family” - Questionnaire. Your classmates got into a fight and are in a quarrel. My school family. Family portrait class. The essence of the problem. Your classmate receives comments during class. Epigraph. How do you understand the word “family”? What is a school family? My family. Class hour. Is our school family a fortress? Why does a person need a family?
“Material and information models” - An even more general information model is the so-called graph structure. Presentation on the topic: “Models”. Let's look at an example. Number of pages. Each individual characteristic common to all possible instances of an object is called an attribute. You can classify attributes into one of three different types: descriptive; pointing; auxiliary.
“Family” - Family photos. School. We know how to relax! Holiday - for the whole family! My bookshelf. Family. Photo of a lesson at a music school. Photos of children and parents. My hobbies. Performance in a dance group. Photo from the excursion. Photo. Day of Knowledge. All-Russian reading lesson. Excursion to the city of Khvalynsk.
“My family” - I’m a big one in my family. The whole family is together, and the soul is in place. “The surroundings of Gzhatsk were distinguished by many water meadows and forests. Reading fairy tales and family stories. In your own family the porridge is thicker. The family is strong together. There was a beautiful forest road leading to the village.” Goodness does not flow through the world like a river, but lives as a family.
Social status of the family and its typology.
Of all the problems facing a modern family, the most important for a social educator is the problem of family adaptation in society. The main characteristic of the adaptation process is social status, that is, the state of the family in the process of its adaptation in society.
The combination of the individual characteristics of family members with its structural and functional parameters develops into a complex characteristic - the status of the family. Scientists have shown that a family can have at least 4 statuses:
1. socio-economic
2. socio-psychological
3. socio-cultural
4. situational role-playing.
The first moment of social adaptation of the family is the financial situation of the family. To assess the material well-being of a family, which consists of monetary and property security, several quantitative and qualitative criteria are needed: the level of income of the family, its living conditions, the subject environment, as well as the socio-demographic characteristics of its members, which constitute socio-economic status of the family.
If the level of family income, as well as the number of housing conditions, is below established standards (the cost of living, etc.), as a result of which the family cannot satisfy the most basic needs for food, clothing, and payment for housing, then such a family is considered poor, its socio-economic status - low.
If the family’s material well-being corresponds to minimum social standards, that is, the family copes with meeting the basic needs of life support, but experiences a shortage of material resources to satisfy leisure, educational and other social needs, then such a family is considered low-income, its socio-economic status is average.
A high level of income and quality of housing conditions (2 or more times higher than social norms), which allows not only to satisfy basic life support needs, but also to use various types of services, indicate that the family is financially secure and has a high socio-economic status.
The second component of a family’s social adaptation is its psychological climate- a more or less stable emotional mood that develops as a result of the moods of family members, their emotional experiences, relationships with each other, with other people, with work, with surrounding events.
To know and be able to assess the state of the psychological climate of the family, or in other words, its socio-psychological status, it is advisable to divide all relationships into separate spheres according to the principle of the subjects involved in them: marital, child-parent and relationships with the immediate environment.
Relationships built on the principles of equality and cooperation, respect for individual rights, characterized by mutual affection, emotional closeness, and satisfaction of each member of this family with the quality of these relationships are considered favorable; in this case, the socio-psychological status is assessed as high.
An unfavorable psychological climate in a family is when there are chronic difficulties and conflicts in one or more areas of family relationships; family members experience constant anxiety and emotional discomfort; alienation prevails in relationships. All this prevents the family from fulfilling one of its main functions - psychotherapeutic, i.e. relieving stress and fatigue, replenishing the physical and mental strength of each family member. In this situation, the socio-psychological climate is low. Moreover, unfavorable relationships can transform into crises, characterized by complete misunderstanding, hostility towards each other, outbreaks of violence (mental, physical, emotional), and a desire to break the ties that bind. Examples of crisis relationships: divorce, child running away from home, termination of relations with relatives.
The intermediate state of the family, when unfavorable trends are still weakly expressed and are not chronic, is regarded as satisfactory; in this case, the socio-psychological status of the family is considered average.
The third component of the structure of family social adaptation is sociocultural adaptation. When determining the general culture of a family, it is necessary to take into account the level of education of its adult members, since it is recognized as one of the determining factors in raising children, as well as the immediate everyday and behavioral culture of family members.
The level of family culture is considered high if the family copes with the role of guardian of customs and traditions (family holidays are preserved, oral folk art is supported); has a wide range of interests and developed spiritual needs; in the family, life is rationally organized, leisure is varied, and joint forms of leisure and everyday activities predominate; the family is focused on the comprehensive (aesthetic, physical, emotional, labor) education of the child and supports healthy image life.
If the spiritual needs of the family are not developed, the range of interests is limited, life is not organized, there is no cultural, leisure and work activity that unites the family, the moral regulation of the behavior of family members is weak (violent methods of regulation prevail); If the family leads a dysfunctional (unhealthy, immoral) lifestyle, then its level of culture is low.
In the case when a family does not have a full set of characteristics indicating a high level of culture, but is aware of the gaps in its cultural level and is active in improving it, we can talk about the average sociocultural status of the family.
The state of the psychological climate of the family and its cultural level are indicators that mutually influence each other, since a favorable psychological climate serves as a reliable basis for the moral education of children and their high emotional culture.
The fourth indicator is situational role adaptation, which is associated with the attitude towards the child in the family. In the case of a constructive attitude towards the child, high culture and activity of the family in solving the child’s problems, its situational role status is high; if in the attitude towards the child there is an emphasis on his problems, then - average. In case of ignoring the child’s problems and, especially, a negative attitude towards him, which, as a rule, are combined with low culture and activity of the family, the situational role status is low.
Typologies: From the existing set of family typologies (psychological, pedagogical, sociological), the following complex typology meets the tasks of a social teacher’s activity, which provides for the identification of four categories of families that differ in the level of social adaptation from high to average, low and extremely low: prosperous families, families at risk, dysfunctional families, asocial families.
Prosperous families successfully cope with their functions, practically do not need the support of a social teacher, since due to adaptive abilities, which are based on material, psychological and other internal resources, they quickly adapt to the needs of their child and successfully solve the problems of his upbringing and development. If problems arise, they only need one-time, one-time assistance within short-term work models.
Families at risk are characterized by the presence of some deviation from the norm, which does not allow them to be defined as prosperous, for example, an incomplete family, a low-income family, etc., and reduces the adaptive abilities of these families. They cope with the tasks of raising a child with great effort, so the social teacher needs to monitor the state of the family, the maladaptive factors present in it, monitor how they are compensated by other positive characteristics, and, if necessary, offer timely help.
Dysfunctional families having a low social status in any of the spheres of life activity or in several at the same time, they cannot cope with the functions assigned to them, their adaptive abilities are significantly reduced, the process of family education of a child proceeds with great difficulties, slowly, and with little results. This type of family requires active and usually long-term support from a social educator. Depending on the nature of the problems, the social teacher provides such families with educational, psychological, and mediation assistance within the framework of long-term forms of work.
Antisocial families- those with whom interaction is most labor-intensive, and whose condition needs fundamental changes. In these families, where parents lead an immoral, illegal lifestyle and where living conditions do not meet basic sanitary and hygienic requirements, and, as a rule, no one is involved in raising children, children find themselves neglected, half-starved, lagging behind in development, and become victims. violence both from parents and other citizens of the same social class. The work of a social educator with these families should be carried out in close contact with law enforcement agencies, as well as guardianship and trusteeship authorities.
Classification of families. Basic functions of the family.
Monogamous patriarchal family- this is a family in which the head and owner of the property is the father. The immediate reason for the transition to this type of family is considered to be the emergence of private property and the related issue of inheritance. Among some nomadic peoples, a young woman was married only after she had a child in her maternal family, that is, she proved that she could be a mother and could bring an heir to property or clan.
Individual (nuclear, monogamous) family- the most common in the modern world. It is distinguished by the fact that it is not only public, but also legally recognized, formed as a result of a legal act - a civil or church marriage, or both. It should be noted that the number of family members tends to decrease. A typical modern family is a husband, wife, one or two children. Along with the decrease in the number of family members, the nature of the relationships between its members also changes.
1.According to the marital history of the spouses. Families are distinguished here:
newlyweds family. This is a newly born family, a family in the honeymoon period, which lasts different times for different people. A typical state for such a family is a state of euphoria: their bright dreams, hopes, plans, often divorced from reality, have not yet dissipated. They still have everything ahead, everything is clear to them, everything in life is simple for them. And they are still confident that together they can move mountains.
young family– the next stage (for some, after six months or a year, and for others much earlier, if the honey period is shortened). This is a family that has encountered its first, unexpected obstacles. Here the spouses suddenly discover from their own experience that love alone is not enough. The first quarrels appear, the desire to change, remake him.
family expecting a child. A young family expecting their first child rises to this level. At this time, the wife changes noticeably, the father becomes unrecognizable. Caring young husband he knows no boundaries towards his wife.
middle-aged family(from three to ten years of cohabitation). This is the most dangerous period of her life. Because it is during these years that boredom, monotony, and stereotypes appear in the relationships between spouses, conflicts flare up, and the majority of divorces occur during this period.
senior family(10-20 years). The moral and psychological well-being of spouses at this stage largely depends on the wealth of their personalities and mutual compliance.
elderly couples. This type of family arises after the marriage of their children and the appearance of grandchildren.
2. Based on the number of children, the following types of families are distinguished:
childless (infertile) families, where no child was born during 10 years of cohabitation. Every third family from this group breaks up on the initiative of men.
one child family. There are 53.6% of such families in cities, and 38-41.1% in villages. Of these families, approximately every second one breaks up. But if such a family persists, then its pedagogical opportunities, the conditions for the child’s growth and development, are not favorable enough. Many sociologists note irresponsibility, lack of hard work and self-centeredness in these people.
small family(family with two children). According to sociologists, family stability increases threefold with the birth of a second child.
large family– this is now considered a family with three or more children. In this type of family, divorces are extremely rare, and if they sometimes happen, it is due to the economic or moral-psychological failure of the husband.
3. By family composition.
single-parent family– when there is only one parent with children in the family. This occurs either as a result of the death of one of the spouses, or as a result of divorce, but often as a result of the illegitimate birth of a child, or even the adoption of someone else’s child by a single woman. Children in these families are distinguished by great independence, understanding and emotionality.
separate, simple family(nuclear) It is formed by spouses with or without children, living separately from their parents. They have complete independence and therefore organize their lives the way they want. Stacked here best conditions for self-expression, manifestation of abilities, personal qualities of each spouse.
complex family (extended)– consists of representatives of several generations. Nowadays, according to sociological research, approximately 70% of young spouses under the age of 20 live in such families. In such a family, life is better organized, young people have more free time, and major quarrels occur less often. At the same time, in such families the question of divorce from parents often arises - due to the interference of some of them in the lives of their children, petty guardianship over them, and due to the natural desire of young people for independence.
big family, consisting of three or more married couples (parental couple and several children with their families). But for a modern person, overloaded with forced communication at work, they are of little use.
Functions.
Social functions refer to the basic needs of society and people that are satisfied by the family. The most important functions of family and marriage include:
1. Population reproduction. Society cannot exist if there is no established system for replacing one generation with another. The family is a guaranteed and institutionalized means of replenishing the population with new generations.
2. Socialization. The new generation that replaces the old one is able to learn social roles only through the process of socialization. The family is the unit of primary socialization. Parents pass on their life experience and modal attitudes to their children, instill the “positive” manners accepted in this society, teach crafts and theoretical knowledge, lay the foundations for speaking and writing, and control the actions of their children.
3. Care and protection. The family provides its members with guardianship, protection, and social security. Children not only need a roof over their heads, food and clothing, but they also need the emotional support of their father and mother at a time in their lives when no one else offers them such protection and support. The family supports those members who, due to disability, old age or youth, cannot take care of themselves.
4. Social self-determination. Legitimizing the birth of a person means his legal and social definition. Thanks to the family, a person receives a surname, name and patronymic, the right to dispose of inheritance and housing. He belongs to the same class, race, ethnicity and religious group to which the parental family belongs. It also determines the social status of an individual.
In addition to those listed, the most important functions of the family include: organizing everyday life, organizing personal consumption, psychological and material support for family members, etc.
Along with its main function, the family performs a number of other important social functions:
educational– socialization of the younger generation, maintaining the cultural reproduction of society;
regenerative(“renewal”) – transfer of status, property, social status;
household– maintaining the physical health of members of society, caring for children and elderly family members;
economic– obtaining material resources from some family members for others, economic support for minors and disabled members of society;
sphere of primary social control– moral regulation of the behavior of family members in various spheres of life, as well as regulation of responsibilities and obligations in relations between spouses, parents and children, representatives of the older and middle generations;
spiritual communication– development of personalities of family members, spiritual mutual enrichment;
sexual-erotic– satisfaction of the sexual needs of spouses, sexual control;
social status– providing a certain social status to family members, reproduction of the social structure;
leisure– organization of rational leisure, mutual enrichment of interests;
emotional– obtaining psychological protection, emotional support, emotional stabilization of individuals and their psychological therapy;
recreational (“recovery”)– the function of restoring psychological health, achieving psychological comfort.
Rights of children and responsibilities of parents.
Declaration of the Rights of the Child. The General Assembly proclaims this Declaration of the Rights of the Child to ensure a happy childhood and the enjoyment, for their own benefit of society, of the rights and freedoms herein provided, and encourages parents to recognize and endeavor to respect these rights.
Principle 1. The child must have all the rights specified in this Declaration. These rights must be recognized to all children, without exception and without distinction or discrimination on account of race, colour, sex, language, religion, political or other opinion, national or social origin, property, birth or other status relating to the child or his or her family.
Principle 2. The child must be provided by law and other means with special protection and provided with opportunities and favorable conditions that would enable him to develop physically, mentally, morally, spiritually and socially in a healthy and normal manner. In making laws for this purpose, the best interests of the child must be the primary consideration.
Principle 3. The child must have the right to a name and citizenship from birth.
Principle 4. The child must benefit from social security. He should have the right to healthy growth and development. To this end, special care and protection must be provided to both him and his mother, including adequate prenatal and postnatal care. The child must have the right to adequate food, housing and medical care.
Principle 5. A child who is physically, mentally or socially disabled must be provided with special treatment, education and care necessary due to his special development.
Principle 6. For the full and harmonious development of his personality, a child needs love and understanding. He should, whenever possible, grow up under the care and responsibility of his parents and, in any case, in an atmosphere of love and moral and material security. A young child should not, except in exceptional circumstances, be separated from his mother. Society and public authorities should have a duty to provide special care for children, not
having families, and about children who do not have sufficient means of subsistence. It is desirable that large families be provided with state or other child support benefits.
Principle 7. The child has the right to receive education, which should be free and compulsory, at least in the initial stages. He should be given an education which is consistent with his general cultural development and through which he can, on a basis of equality of opportunity, develop his abilities and personal judgment, as well as a sense of moral and social responsibility, and become a useful member of society.
The best interests of the child should be the guiding principle for those responsible for the child's education and learning, and this responsibility lies primarily with the parents.
The child must be provided with full opportunity for games and entertainment, which would be aimed at the goals pursued by education. Society and public authorities must make efforts to facilitate the implementation of this right.
Principle 8. The child must be protected from all forms of neglect, cruelty, and exploitation. It should not be trafficked in any form.
Principle 9. A child should not be employed before reaching the appropriate age minimum. He shall in no case be assigned or permitted to do any work or occupation which would be harmful to his health or education or which would interfere with his physical, mental or moral development.
Principle 10. The child must be protected from practices that may encourage racial, religious or any other form of discrimination. He should be brought up in the spirit of mutual understanding, tolerance, friendship between peoples, peace and universal brotherhood, and in the full consciousness that his energies and abilities should be devoted to the service of the benefit of other people.
Responsibilities of parents. It is the responsibility of parents to raise their children. They bear responsibility for them and are responsible for their health, physical, mental, moral, spiritual development. Parents are obliged to provide their child with basic general education. Every child must attend school.
It is the responsibility of parents to protect the interests of their children. They are the child’s legal representatives and can defend their rights and interests in relations with individuals and legal entities. Parents do not have this right only if the guardianship authorities consider the parents’ actions to be contrary to the interests of the child.
Parents do not have the right to harm the health of their children, including mental health and moral development. They bear responsibility in accordance with the procedure established by law. Parents should not show cruelty, treat the child with disdain, insult or humiliate the child.
If parents have disagreements in matters of raising and educating a child and cannot resolve them on their own, they have the right to appeal to the guardianship and trusteeship authorities or even to court.
It is the responsibility of parents to support their children. If parents avoid such responsibilities, then alimony payments can be collected in court. If necessary, parents can enter into an agreement to pay child support, and if there is no agreement, the court will collect these funds.
Today, a family is assessed by its level of financial situation. It reflects income and quality of life. In many ways, the area is related to profession, payment of social assistance and other factors. Financial situation is assessed almost everywhere: at school, at work, in kindergarten. This is also important when assigning various payments.
Many families do not have enough income, so in most regions there is a provision on It provides the opportunity to receive benefits in the event of difficult situations. Additional payments are provided to families with many children and low-income families, unemployed citizens, disabled people and other social groups.
Family budget structure
The financial situation of a family is assessed by the income received by all members. Also important here are expenses that are spent on the necessities of life. Income consists of funds received in the form of wages, benefits, alimony, pensions, and interest on deposits. Some families receive help from relatives.

Expenses are the funds necessary to ensure a comfortable life for the family. Expenses can be constant or unexpected. The first include regular payments for housing, services, and education. You constantly need to spend money on food, medicine, and household products. Money is regularly needed for recreation, entertainment, and holidays.
Unforeseen expenses are those that appear unexpectedly in a family, but cannot be avoided. For example, urgent treatment or routine medical examination was required. Also, expenses may be necessary due to the breakdown of some equipment. This is what the financial situation is built on.
Features of calculating the financial situation of a family
A family's wealth can be calculated based on the income of its members. The calculation takes into account wages, part-time work, scholarships, benefits, and alimony. Each type of income has its own transfer specifics, outlined in the law. Funds can be received by bank transfer or in cash.
The level of material wealth is confirmed by payment documents indicating the receipt of funds. For example, if a person receives a salary on a card, the statement will serve as proof of regular income. The same applies to these methods to confirm a person’s solvency.
Proper distribution of expenses
It is necessary to determine the expenses that occur every month. If the data is recorded, this process can be easily controlled. It is necessary to identify expenses that can be waived and those that are necessary.
For those who need it, it is advisable to have several envelopes where the money should be placed. This will allow you to spend money economically.
Payments
Whatever the financial situation, it is necessary to pay. Only low-income families can be provided with benefits for such expenses. For example, in the form of a reduction in amounts. Mandatory payments include:
- public utilities;
- loans;
- other payments.

Household expenses
A person’s financial situation determines the ability to purchase goods of varying quality. Household expenses include food, medicine, and hygiene products. They should also be controlled to avoid unnecessary expenses.
There are also proven ways to save money. For example, it is much cheaper to cook food at home than to buy it from finished form or eat in a cafe. Moreover, homemade food is tastier and healthier.
Stock
If it happens often, it is advisable to have spare money. They can be useful for vacations, shopping, and repairs. Funds for teaching children are also needed.
It is advisable to put spare money in a bank account or book. This will preserve them for a long time. In addition, they accrue interest.
Salary
Financial situation is assessed by wages. Typically, this type of income in each family is considered the main one. All able-bodied citizens, including teenagers, receive it.

Wages are considered remuneration for hired labor. Its size is determined by many factors. Usually the amount is affected by the position held, as well as work experience. Often the employee’s financial situation is not satisfactory, and he looks for other ways to earn income.
Entrepreneurial activity
Many citizens switch from their main jobs to entrepreneurial ones. By opening a profitable business, you can adequately provide for your family. The main thing is to work hard.
Income received from this activity is included in the family budget. It does not matter whether the work is carried out independently or with the help of hired employees.
Scholarships
Another source of income is the stipend paid to students and cadets. As a rule, they are issued to students of free departments. Although this income is small, it is still included in the family budget.

Help
Like expenses, income can be unpredictable. For example, relatives can help the family. Although such income is not recorded anywhere, it is still included in the family budget.
Who gets this kind of help? Usually young families and elderly parents are in dire need of it.
Income from property
Family income consists of another interesting item - the sale of property. This only applies to cases where there is additional real estate. You can also earn income from it, which may become permanent.
![]()
Funds received from the sale of property are also considered family income. For example, you can rent out an apartment, garage, house. Money from the sale of property is contributed to the family budget.
Benefits
Due to the difficult financial situation, many families cannot afford basic means of life. Many social groups receive benefits, which are also considered part of the family budget.
Benefits are paid. Only in this case is documentary evidence required that the income is less than the subsistence level. Then the family has the right to receive funds. Help may be provided in difficult financial situations.
Unemployed citizens are also paid benefits. You just need to register with the labor exchange. Additional payments are provided for pregnancy and childbirth, as well as for child care. They are provided by employers and authorities social protection. Benefits are also provided for disability, and they are paid to adults and children.
Pensions
Family income includes a type of benefit such as a pension. Cash is paid in old age when a person is unable to work. In Russia, men retire at 60, and women at 55. There are social groups that retirement age reduced. For example, military personnel begin to receive such benefits earlier.

Pensions may be paid for disability. The amounts depend on the severity of the illness. This is usually determined by medical tests, according to which documentation is issued.
Pensions are accrued in the event of the death of the breadwinner. Benefits are paid to children until they reach adulthood, and then automatically stop. In this case, the pension will serve as the main source of child support, and its amount is determined on the basis of legislative documents.
Alimony
Family income includes alimony, which is paid to the child by one of the parents in the event of family breakdown. They can also be approved for a spouse, for example, when caring for a child under 3 years old. This income is spent on maintaining the mother and child.
Alimony can be approved in a fixed amount or in the form of a percentage. It depends on the former spouses how they will determine payments - by mutual agreement or through the court. Alimony is also accrued in marriage, when there is no necessary income to ensure a normal life for the child.
Such payments are also provided by children for the maintenance of disabled parents if the latter went to court. Then a fixed amount of alimony is approved.
Inheritance
Basic incomes are quite different. But not all points can be found in every family, since this issue is individual. Income includes receiving funds by inheritance.
If someone has drawn up a gift or inheritance, this can serve as a source of profit. And it doesn’t matter to whom exactly it is issued. As a rule, inheritance in the form of property begins to be sold, which is an important source of income.
Part time job
When there is not enough money from the main income, they look for an additional source. This could be a part-time job in your free time. It can be official or not. Often, part-time work has a noticeable effect financial assistance family, especially those with financial difficulties.
Everyone determines the financial condition of the family. It allows you to assess the quality of life of people. To assess the situation, surveys are often conducted to determine the wealth of different social groups. Every family's situation is different, which affects their lives as a whole.
| Summary: Indicate one of the most important signs attractiveness of a man's profile, about his financial situation: inconsistent earnings, constant small, average or good income, security. Visual communication: There are no more hundred rubles, where are you hundred friends?!
An optimistic view of what is good and what is the benefit: There are a lot of profiles of smart, young and rich men on the dating site. Therefore, girls need to choose for themselves the two most important qualities from three listed when viewing the profiles of applicants for your hand and heart, and these two qualities should be used to guide your choice. The questionnaire item about financial situation tells about wealth and prosperity. There is never a lot of income; the more, the better, all other things being equal. Therefore, the benefits are behind the answers. stable average income or , when it is possible to take out loans and purchase an apartment, cars, and improve living conditions. A balanced, serious approach: Although, for a serious relationship the answer is important stable average income, I make good money / I'm well off, but the answer will suit many constant small income, for lack of anything better. And even inconsistent earnings, provided that there is a desire to work, there are no bad habits and compliments are made and gifts are given. Low incomes are embarrassing because they may indicate that a person has not found a use for himself in life, has not occupied a social niche worthy of his age. However, a low income may indicate that the employee does not consider it necessary to kill himself, burn out at work, and has energy for his home, family, and relationships. The most difficult case is if a specialist moves from paid hired work to work related to starting his own business, because there is a high risk of ending up without income and incurring losses, and the nervous load increases. How to avoid mistakes due to lack of experience and practice: When indicating your high or average financial situation, pay attention to income matching professions, if average salaries by profession in your region can be found on the Internet, then provide links, information about education and knowledge English language, existing car and living conditions, indicate priority career growth. The main evidence of your financial situation on a dating site will be the level of expenses, rather than available income, that you are willing to incur for dating purposes, during meetings, walks, and travel. Communication with foreigners, foreign experience, shopping abroad on the Internet: Annual Income - Your annual incomeAnnual Income Your annual income, earnings for 12 months and other income received in US dollars at the current exchange rate to be calculated. Select income please Please indicate the range in US dollars that includes your entire annual income. Prefer Not To Say I prefer to modestly remain silent about my financial achievements. Less than US$20,000 My income is less than $20,000 per year or less than $1,700 per month. In other words, less than approximately 48,000 rubles per month at the current Bank of Russia exchange rate. US$20,001 - $30,000 My annual income ranges from $20,001 per year to $30,000 per year. In other words, approximately from 48,001 to 72,000 rubles per month at the current Bank of Russia exchange rate. US$30,001 - $40,000 My annual income ranges from $30,001 per year to $40,000 per year. In other words, approximately from 72,001 to 96,000 rubles per month at the current Bank of Russia exchange rate. US$40,001 - $1 million My annual income ranges from $40,001 per year to one million dollars per year. Find out a more specific range yourself and choose the most appropriate answer.Net Worth - Property valueNet Worth The market value of all your property at the moment, which you possess and of which you are the owner, for example, cash savings, apartments, dachas, cars. If the property was received on credit, but the loan has not yet been repaid, then the property is taken into account partially, in proportion to the amount of loan or other obligations already repaid. If the property is insured, then the value of the property that will be reimbursed to you in the event of an insured event can be found out from the insurance policy. Select net worth please Please indicate the range in US dollars within which the entire value of your property falls. Prefer Not To Say I prefer to modestly remain silent about the value of the property that I own. Less than US$10,000 The cost of all my acquired property and existing cash savings does not exceed $10,000 or approximately 300,000 rubles at the current Bank of Russia exchange rate. US$10,001 - $100 million I declare that the value of all my property and cash savings is in the range from $10,000 to $100 million, and now I will be more specific. |

With great interest in work and above-average income, it is important to know the cost structure
With high, stable salaries, it is possible to take out a loan and make payments on it to buy a car, an apartment, in addition, help parents, educate children, and make home renovations. And such loans are sometimes taken one after another, there are no breaks, when a person feels free, that he does not owe anything to anyone, therefore, he is forced to be thrifty, which from the outside may seem greedy.
When the questionnaire reports high income, interest in work, career growth, material wealth, then try to understand what the structure of basic expenses is, whether there are payments on large loans, what are the opportunities to spend money on communication and acquaintances, i.e. pay in full or in part for joint trips to cafes, restaurants, cinemas, theaters, concerts, exhibitions, trips. When seriously dating for the purpose of marriage, it is important to understand that in the event of death, both savings and debts are inherited upon entering into an inheritance.
Hard work, creative fulfillment requires active emotional rest in a romantic environment, exhausting, but brings income
When striving for career growth, advancement through the ranks, or material wealth, people who want to meet on a dating site often work intensively and intensely. It’s stressful because they strive to choose industries and positions where wages are as high as possible, and, accordingly, where social status is higher, which is very attractive from the point of view of dating. For example, they get a job in a foreign company or move to another city with a promotion.
However, the reality is that money or wages higher than others are not simply paid, and they are not promoted in position. And, employers increase demand and responsibility, you have to work in an environment with increased psychological or physical activity, with difficult management at the head or increased turnover among subordinates, to whom you constantly need to look for approaches.
If the questionnaire indicates a profession or position, then pay attention or ask what the nature of the work or study is, look for information on the Internet. How much a person, in your opinion, can wear out at work, how much he may need to unwind from boring everyday life through the opportunity to meet an interesting person on the site. If there is a need for creative realization, with active social activities, there is also a need to search for new ideas, fresh thoughts, and vivid impressions.
Please note that if the profile on the website contains photos from vacations in exotic countries, tourist capitals are listed in your favorite cities different countries, this may mean that a person has material income that allows him to go on an expensive vacation, and a high need to restore peace of mind, gain fresh impressions and new positive emotions.
The path to the heart of such a busy person often heals through creating emotional comfort in communication and correspondence, creating an atmosphere of love and romance. For his part, perhaps such a person will help solve your material problems, but he does not always have additional mental resources to endure personal troubles or the desire to adapt to you.
It happens that the higher the income and position, the higher the emotional load of a person, the higher the need for confidential communication and understanding. Likewise, the more busy everyday life is or the more difficult your studies are, for example, away from your family or home, the more you will find a greater inclination and need to get to know and create serious relationship, if, of course, a person has free energy and time to communicate.
There are people who are quite busy with school, work, and household chores, but nevertheless, they know how to plan their time so as to have time to pay attention to their personal life. Moreover, because of their composure, sometimes they accomplish more than less busy people, achieve what they planned, and therefore are satisfied with life. Look for such questionnaires, where in the section About me the words used in the text convey an optimistic mood and the photographs speak of the ability to lead an active lifestyle.
Many people love their work, their business, and successfully cope with nervous stress, but they also consider going on vacation, communicating on weekends, and outside of work hours as a saving outlet for themselves. Try to understand from the questionnaire what the person needs, offer to walk the streets together, visit a cafe or social event on weekends, explain what will be unusual and interesting there.
Measured work brings more pleasure and peace of mind than income
And, if a person does not overexert himself in school or at work, knows how to leave work on time, and leads a healthy lifestyle, then an intensive vacation in an exotic country may not be required, and such photographs about extreme types of recreation may not be in the profile. Lovers of a slow life have photos about country romance, outdoor recreation, and hobbies in their profiles. If you like peace of mind, health, the opportunity to raise a child either in nature or on your own without the services of a nanny, then take a closer look at applications where the position does not promise a high income, but also does not exhaust the person so much that he needs special rest.


